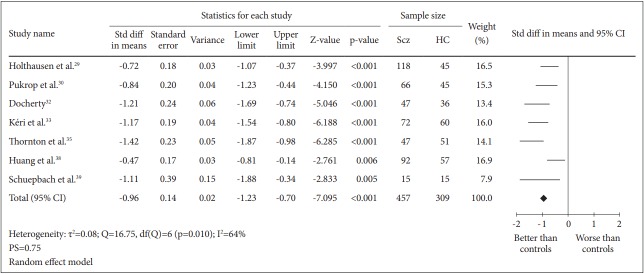
Figure 4.
Measure of cognitive flexibility using TMT-B. Horizontal lines represent 95% confidence interval (CI). The diamond represents the point estimate for the effect size. The vertical line represents the reference of no difference in means between the schizophrenia (Scz) group and healthy control (HC) group. df: degree of freedom, std diff: standardized difference, τ2 : tau-squared. TMT-B: Trail Making Test B.

