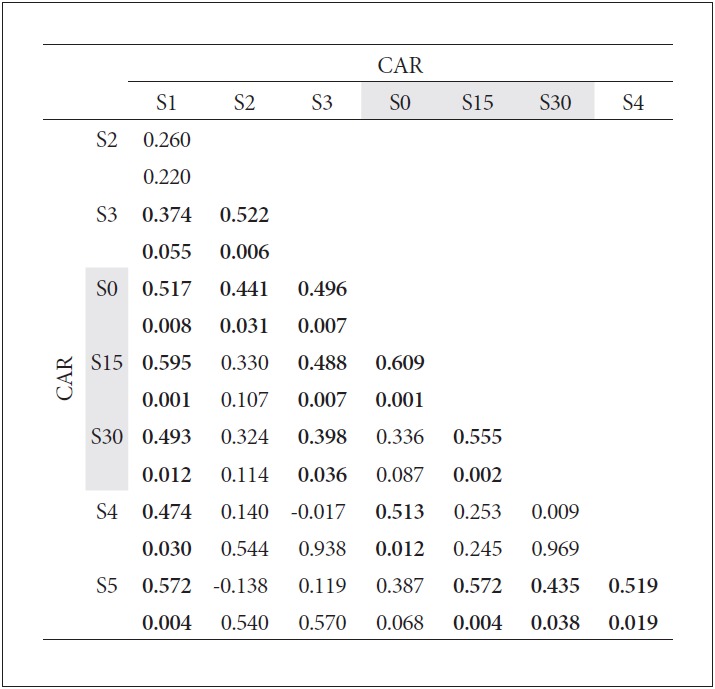
Figure 3.

Pearson correlations among the log10-converted salivary cortisol data. In each cell, the upper value is the correlation coefficient (r) and the lower value is the p value. Significant correlations are shown in bold. In general, all data seem to be inter-correlated, but S1 cortisol levels (sample taken after the lunch on Day 1) best describe the data taken afterwards (except S2). Additionally, S3 level (sample at midnight) is positively and significantly correlated with all cortisol awakening response (CAR) data. Data before and after psychodrama session (S4 and S5, respectively) are also positively correlated.
