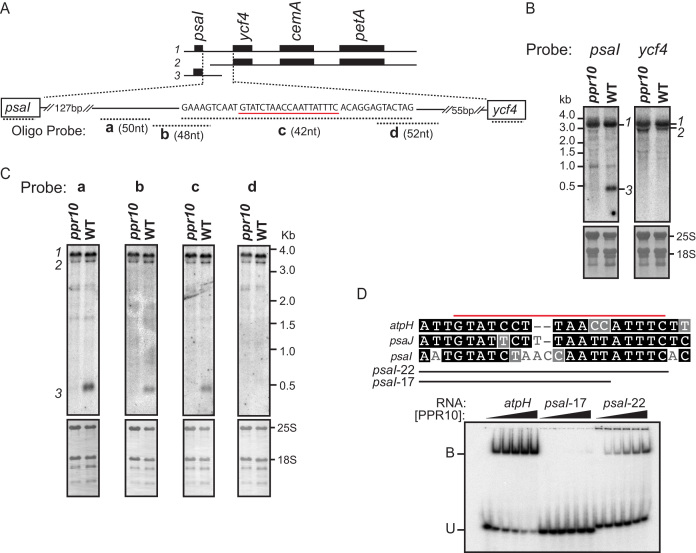
Figure 1.
PPR10 defines and stabilizes the 3′-end of monocistronic psaI RNA. (A) The psaI-ycf4-cemA-petA transcription unit. The three transcripts detected by RNA gel blot hybridization are diagrammed at top. The oligonucleotide probes used in panel (C) are diagrammed below in relation to the expansion of the psaI-ycf4 intergenic region. Probe lengths are not drawn to scale, but their overlap with one another is precisely shown by the nucleotide sequence above. The sequence underlined in red resembles known PPR10-binding sites (see panel (D)), and ends 430 nt downstream from the psaI transcription start site (53). (B) RNA gel blot hybridization showing the loss of monocistronic psaI RNA in ppr10 mutants. The two panels come from the same gel and were hybridized with gene-specific probes for either psaI or ycf4 RNA. Excerpts of the same blots stained with methylene blue are shown below to illustrate rRNA abundance. The transcripts are numbered to the right, according to the scheme shown in panel (A). (C) Mapping the 3′-end of monocistronic psaI mRNA by high-resolution RNA gel blot hybridization. Replicate panels from the same gel were hybridized to the oligonucleotide probes diagrammed in panel (A). (D) Gel mobility shift assay demonstrating that PPR10 can bind to the sequence at the 3′-end of the PPR10-dependent psaI transcript. A comparison of the psaI site with the known atpH and psaJ sites is shown at top; the red line marks the minimal binding site established for atpH (14). PPR10 was used at 10, 5, 2.5, 1.25 or 0 nM.

