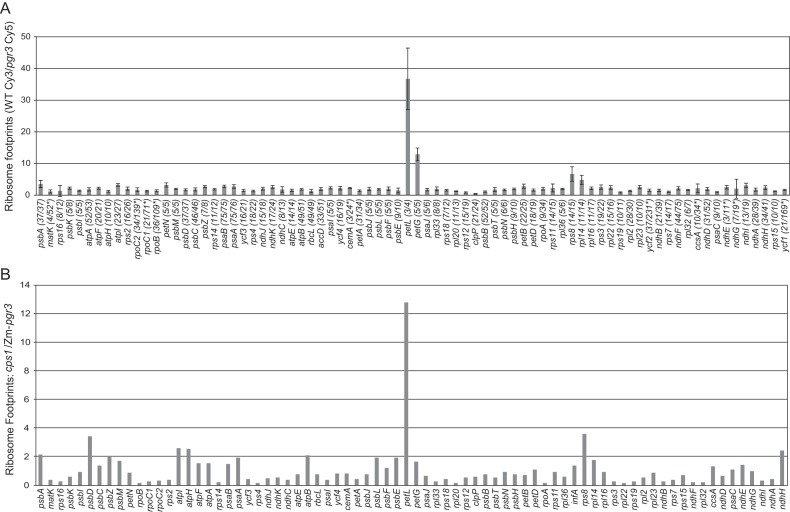
Figure 2.
Analysis of chloroplast gene expression in Arabidopsis and maize pgr3 mutants by ribosome profiling. (A) Ribosome footprints from seedling leaves of the Arabidopsis pgr3 mutants and their normal siblings were detected by hybridization to high-resolution microarrays spanning the whole chloroplast genome. The values shown are the median ratio (wild-type:mutant) of the median normalized signal intensities among all 50-nt array probes mapping within each ORF. Error bars represent the standard deviation calculated from all probes covering the ORF. Each ORF is annotated with the number of probes whose signal was above background as a fraction of the total number of probes. Genes for which fewer than half of the probes were above background are marked with an asterisk; their values could not be assessed with confidence. (B) Ribosome footprints from seedling leaves of the maize pgr3 mutant (Zm-pgr3) were mapped by deep sequencing. The values shown are the ratio of normalized read counts for each gene in cps1-1/2, a mutant with a plastid ribosome deficiency similar in magnitude to that of Zm-pgr3. Read counts were normalized to the total number of reads mapping to chloroplast ORFs. A comparison to the wild-type is shown in Supplementary Figure S2A.

