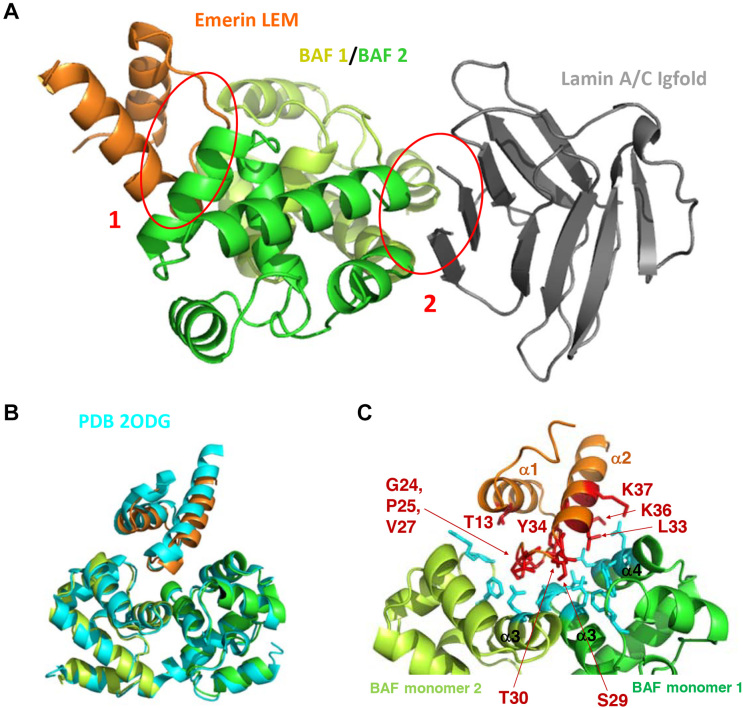
Figure 3.
Three-dimensional structure of the complex between LamIgF, emerin LEM domain and BAF. (A) Cartoon representation of the complex, with emerin LEM domain (residues 3–44) in orange, BAF dimer in yellow-green and green (residues 4–89), and lamin A/C Igfold domain (residues 432–544) in gray. The interfaces corresponding to the emerin / BAF and BAF / lamin interactions are indicated by red circles and numbered as 1 and 2, respectively. (B) Superimposition of the 3D structure of the BAF dimer bound to the emerin LEM domain, as determined in this work (same colors as in (A)), and as revealed using NMR by Clore et al. (PDB reference 2ODG (19); in cyan). (C) Zoom on the EmN/BAF interface, with residues >30% buried within the interface displayed in sticks. On the emerin side, the interface is mainly formed by residues Gly24 to Lys37 (labeled residues on loop α1α2 and helix α2). On the BAF side, it is mainly formed by helices α3 and α4 of one monomer and loop α2α3 and helix α3 of the other monomer.

