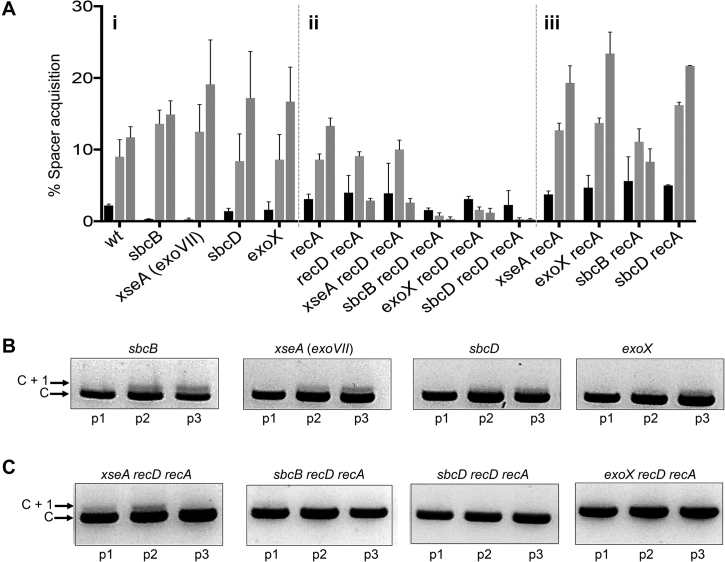
Figure 2.
Analysis of 3′→5′ ssDNA exonucleases in naïve adaptation. (A) Graph summarizing measurements of new spacer acquisition in the strains indicated detectable as expansion of CRISPR-1 (C+1) using PCR of chromosomal DNA from the strains indicated. See also Supplementary Table S3. Percentage spacer acquisition refers to intensity of C +1 DNA/(C+1 DNA + C DNA). Each strain indicated below the x-axis has three histograms representing measured adaptation in passage one (black), two (light grey) and three (light grey). (B and C) Agarose gel slices summarizing naïve adaptation effects shown for strains selected from the graph. All strains contained the plasmid encoding inducible Cas1–Cas2 complex (pCas1–2).

