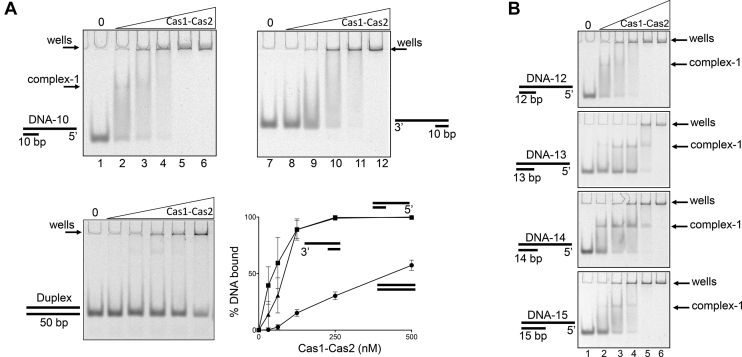
Figure 4.
Comparative mobility shift analysis of Cas1–Cas2 binding to DNA substrates. (A) Electrophoretic mobility shift analysis of increasing concentrations of Cas1–Cas2 binding to 5′ overhang, 3′ overhang and duplex DNA as indicated. Oligonucleotide sequences used to prepare the substrates are shown in Supplementary Figure S2. Cy5 end labeled DNA substrates (20 nM) were incubated with 0, 31.25, 62.5, 125, 250, 500 nM Cas1–Cas2 complex for 30 min at 37°C followed by analysis on a 5% native acrylamide gel and imaged using a FLA3000 (FujiFilm). The graph shows quantified binding of Cas1–2 to 5′ overhang (▪), 3′ overhang (▴) and duplex DNA (•) DNA substrates. Band quantification was carried out using ImageJ (NIH) as a normalized value of bound substrate as a percentage of total Cy5 fluorescence per lane, with error bars showing the standard error (n = 3). (B) EMSAs comparing Cas1–Cas2 complex formation with 5′ssDNA tailed duplexes of varying lengths, as indicated. Assay conditions were the same as used in EMSAs in part A.

