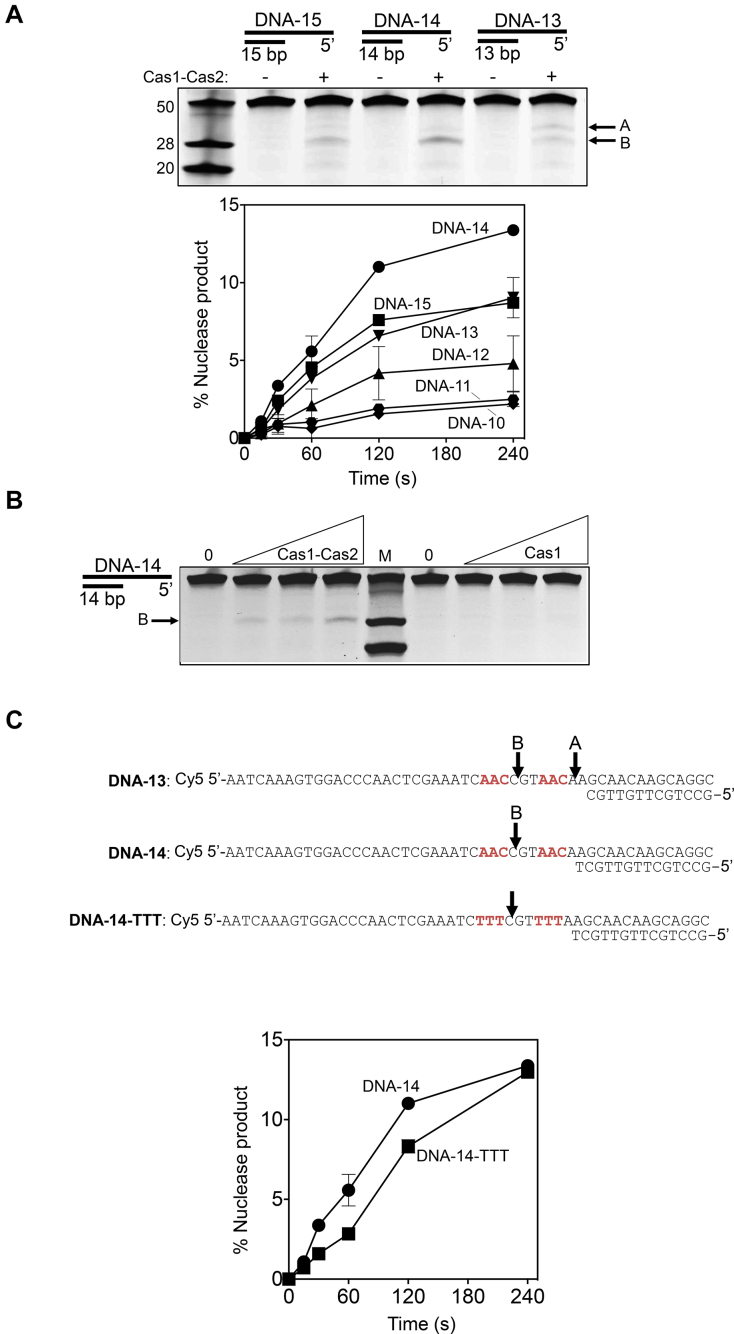
Figure 5.
Nicking of DNA substrates by purified Cas1–Cas2 complex. (A) A summary of Cas1–Cas2 nicking activity on 5′-ssDNA tailed DNA duplexes, as indicated. Oligonucleotide sequences used to prepare the substrates are shown in Supplementary Figure S2. Marker ssDNA nucleotide lengths are given to the left of the gel panel. Cy5 end labeled DNA substrates (20 nM) were incubated with 0 or 250 nM Cas1–Cas2 complex for 60 minutes at 37°C, followed by analysis on a 15% denaturing acrylamide gel and imaged using a FLA3000 (FujiFilm). Arrows indicate the major nicking products (A and B) generated by Cas1–Cas2. The graph shows cutting activity of Cas1–Cas2 complex (250 nM of total protein) on 5′-ssDNA tailed DNA duplexes (20 nM) as indicated, as a function of time. Reactions were in duplicate and error bars represent standard deviation from the mean values. Details of each substrate are given in Supplementary Figure S2. (B) Nuclease activity on DNA-14 (20 nM) of Cas1–Cas2 complex (0, 62.5, 125 and 250 nM) compared to the same assays containing only Cas1 at the same concentrations. The three DNA marker fragments are the same as Figure 5A and the major cutting product B is indicated. (C) Illustration of Cas1–Cas2 cutting sites identified in substrates (see also Supplementary Figure S6). The graph compares Cas1–Cas2 (250 nM) cutting activity, as a function of time, when mixed with DNA-14 and DNA-14-TTT, as indicated, and is plotted as means of two independent assays with standard deviation displayed as error bars.

