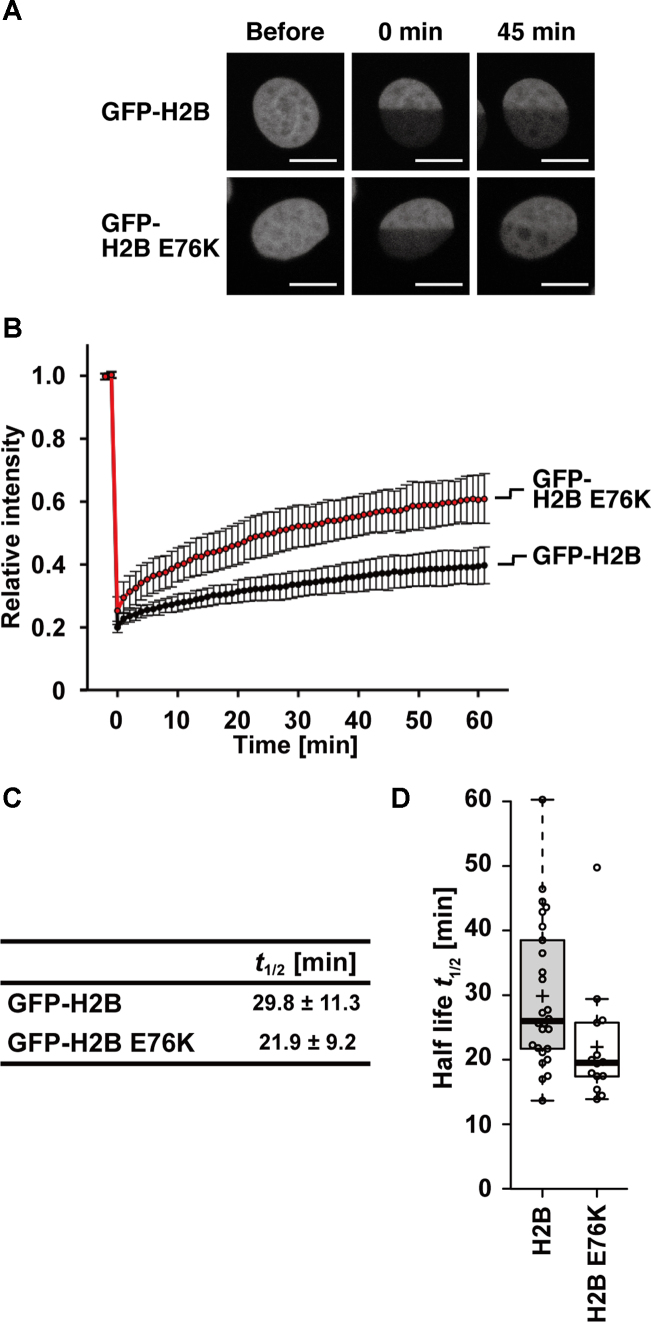
Figure 4.
Mobility of GFP-H2B E76K in living cells. (A) Representative fluorescence images of HeLa cell nuclei producing GFP-H2B or GFP-H2B E76K, before and after photobleaching. One-half of the nuclei were bleached using a 488-nm laser. Bars, 10 μm. (B) Relative fluorescence intensity of the bleached area, normalized by the unbleached areas. Intensities were obtained from 2 min before photobleaching to 60 min after photobleaching. Averages with standard deviations are plotted (n = 28 and 22 for GFP-H2B and GFP-H2B E76K respectively). (C) The half-lives of GFP-H2B and GFP-H2B E76K were estimated from the averages of FRAP curves of 26 and 14 cells for GFP-H2B and GFP-H2B E76K, respectively. (D) Box plots of the half-lives of GFP-H2B and GFP-H2B E76K FRAP curves.

