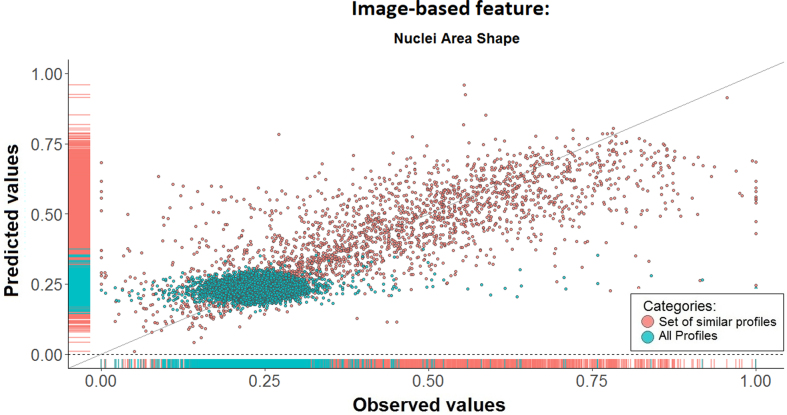
Figure 2.
Prediction of the image-based feature from transcriptomic data is improved by model learning from similar transcriptomic and image-based profiles. This scatter plot shows the predicted versus experimental values of the Nuclei Area Shape image-based feature in response to treatment with 9515 drugs or small compound molecules. There is a clear improvement in prediction performance when using our proposed subset selection approach (red) versus using all profiles (green).

