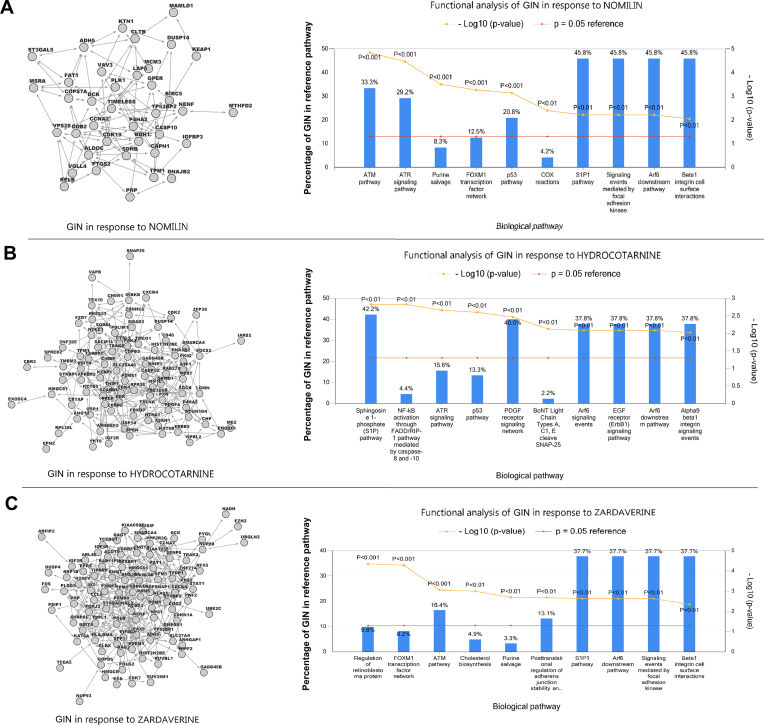
Figure 4.
The topology and cellular functions of a gene interaction network (GIN) in response to treatment with NOMILIN (A), HYDROCOTARNINE (B), and ZARDAVERINE (C). On the left are graph-based visualizations of gene interaction networks, including gene-gene interactions selected based on the cell morphological gene sets and transcriptomic profiles in the repository subset (Ts). On the right are bar charts of the top 10 enriched biological pathways in the regulatory networks of osteosarcoma cells in response of the three treatments. We used functional pathway analysis to associate genes in the regulatory networks with predefined gene sets related to biological pathways (26). The sizes of some reference pathways are identical and they share common genes; therefore, the overlap between genes in the GIN and some enriched pathways are similar (e.g. S1P1 pathway and Arf6 downstream pathway).

