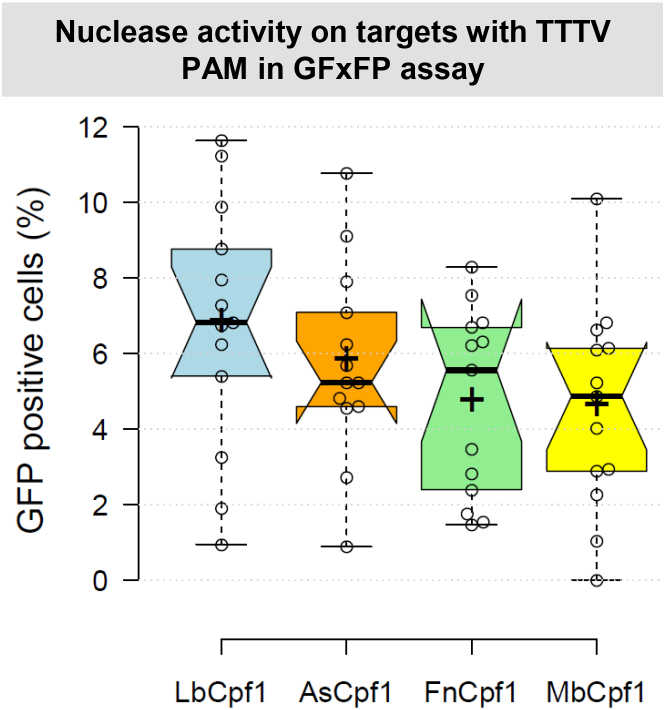
Figure 1.
Comparison of cleavage efficiencies of different Cpf1 nucleases in GFxFP plasmid-based assay in mouse N2a cells. Percentages of GFP positive cells counted above the background level, resulting from the action of various nucleases (blue – LbCpf1, orange – AsCpf1, green – FnCpf1, yellow – MbCpf1). Thirteen randomly picked targets cloned into the pGF-ori-FP vector (19) were tested using the GFxFP assay. The target vectors along with the corresponding nuclease vector were transfected into N2a cells and GFP positive cells were counted 2 days after transfection. All samples are also cotransfected with an mCherry expression vector to monitor the transfection efficiency and the GFP signal is analyzed within the mCherry positive population. The background fluorescence was estimated by using a crRNA-less, inactive AsCpf1 nuclease expression vector as negative control and was subtracted from each sample. Three parallel transfections were made for each case. Tukey-type notched boxplots by BoxPlotR (53): center lines show the medians; box limits indicate the 25th and 75th percentiles; whiskers extend 1.5 times the interquartile range from the 25th and 75th percentiles; notches indicate the 95% confidence intervals for medians; crosses represent sample means; data points are plotted as open circles that correspond to the different targets tested. See also Supplementary Figure S3.

