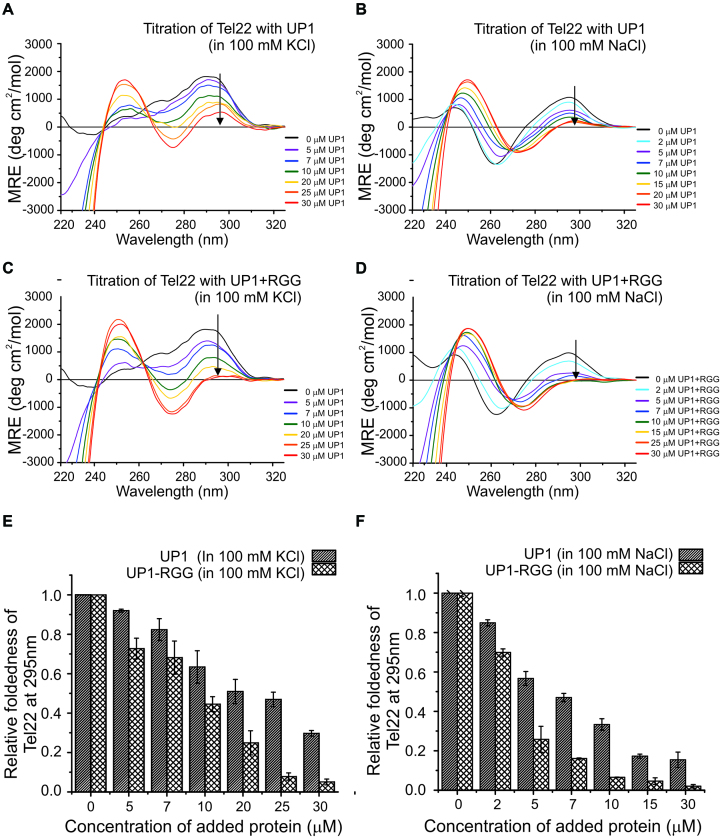
Figure 7.
Telomere DNA G-quadruplex unfolding by UP1+RGG and UP1 monitored using CD spectroscopy. (A, B) Unfolding of K+ and Na+ forms of Tel22 G-quadruplex DNA by UP1. The G-quadruplex DNAs were titrated with increasing molar excess of proteins. The black arrow in the spectra indicates the gradual decrease in ellipticity at 295 nm with increasing protein concentration. (C, D) Unfolding of K+ and Na+ forms of Tel22 G-quadruplex DNA by UP1+RGG. The G-quadruplex DNAs were titrated with increasing molar excess of proteins. The black arrow in the spectra indicates the gradual decrease in ellipticity at 295 nm with increasing protein concentration. (E, F) The ellipticity at 295 nm was normalized and plotted to show the relative foldedness of both K+ and Na+ forms of quadruplexes upon UP1 or UP1+RGG addition at each step of titration.

