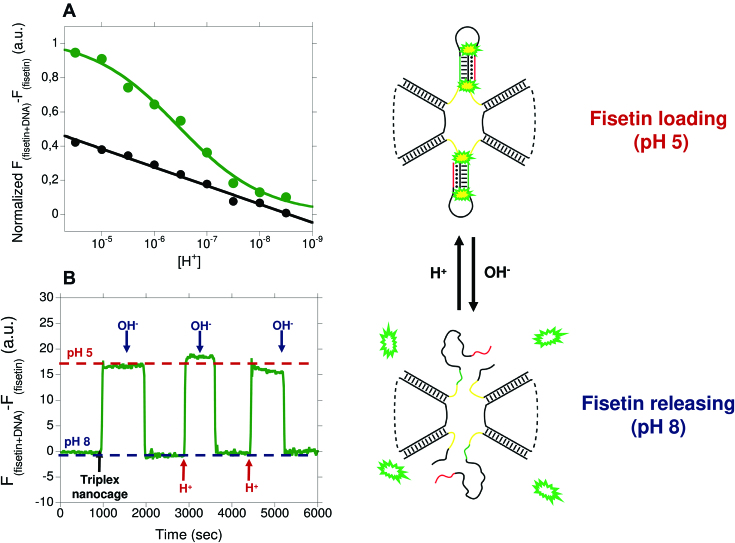
Figure 6.
(A) pH−titration curves of the LT-cage (green curve) and its control duplex cage (black curve) achieved in TAE buffer at 25°C and using a cage concentration of 250 nM. Triplex-to-duplex transition is monitored taking the difference in the fisetin's fluorescence signal in presence and absence of the DNA cage at different pH values. (B) Reversible behaviour of the switching mechanism followed cyclically changing the pH of a solution containing the LT-cage and fisetin from 5.0 to 8.0.

