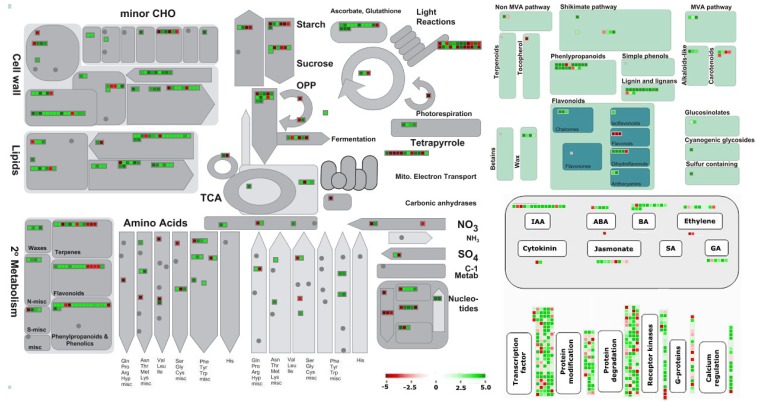
Figure 5.
MapMan visualization of changes in transcript levels over the main metabolic process in CBCVd-infected compared with mock inoculated hop. The log2 fold changes of significantly differentially expressed genes were imported and visualized in MapMan. Red and green displayed signals represent a decrease and an increase in transcript abundance, respectively, in CBCVd-infected relative to the mock inoculated samples of hop. The scale used for coloration of the signals (log2 ratios) is presented.

