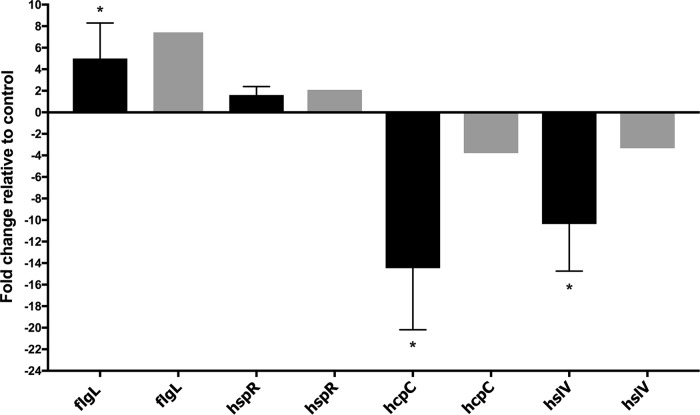
FIG 6.
qPCR validation of the transcription of selected differentially expressed genes. The data indicate the fold change in expression of genes in H. pylori biofilm cells compared to planktonic cells. Fold changes in gene expressions were calculated after normalization of each gene with the constitutively expressed gene control gapB. Bars represent the mean and error bars the standard error of the mean. Black and gray bars represent qPCR and RNA-seq results, respectively. Statistical analyses were performed using threshold cycle (2−ΔΔCT) values, and all results with an asterisk were statistically significant (P < 0.01).

