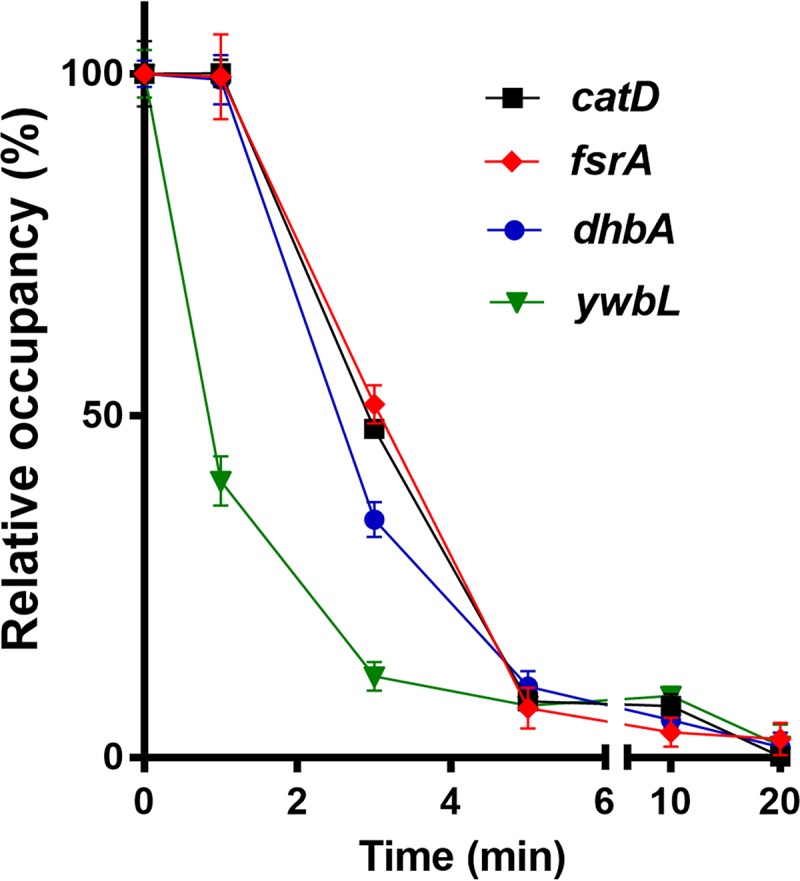
FIG 9.

Fur occupancy on different operator sites. Fur occupancy was evaluated by ChIP-qPCR. DNA enrichment was calculated based on the input DNA (1% of total DNA used for each ChIP experiment). Fur occupancy at different sites was set as 100% at the zero time point. Dates are presented as the relative percentage (%) of occupancy at different time points after 1 mM IPTG induction of FrvA (mean ± SEM; n = 3). No significant DNA enrichment was observed for gyrA, which is used as a nonspecific negative control.
