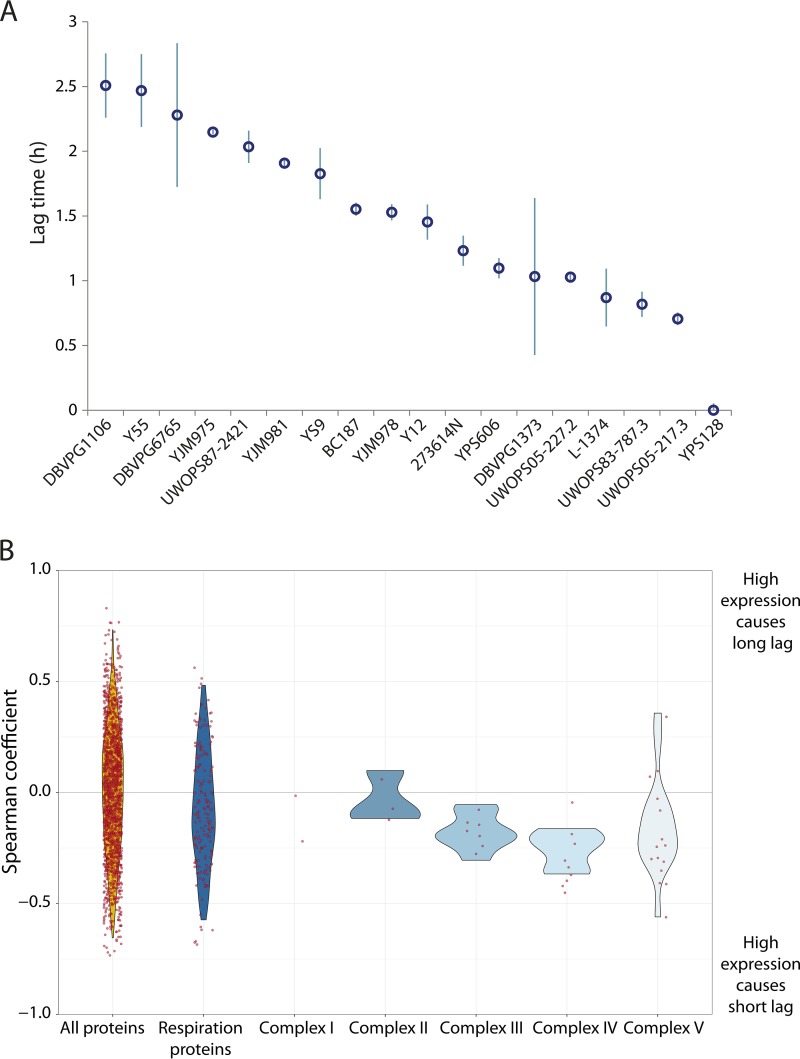
FIG 5.
The glucose-to-galactose lag times of different natural S. cerevisiae strains correlate with their expression of respiratory proteins in medium containing glucose. (A) Population lag times of 18 different S. cerevisiae strains during a gradual shift from glucose to galactose. Error bars correspond to standard deviations of 3 or more biological replicates. (B) Violin plots of the Spearman correlation coefficients between the protein expression obtained by Skelly et al. (45) of 18 S. cerevisiae natural strains and their lag times when shifting from glucose to galactose. Red dots indicate correlation coefficient of individual proteins.

