Figure 2.
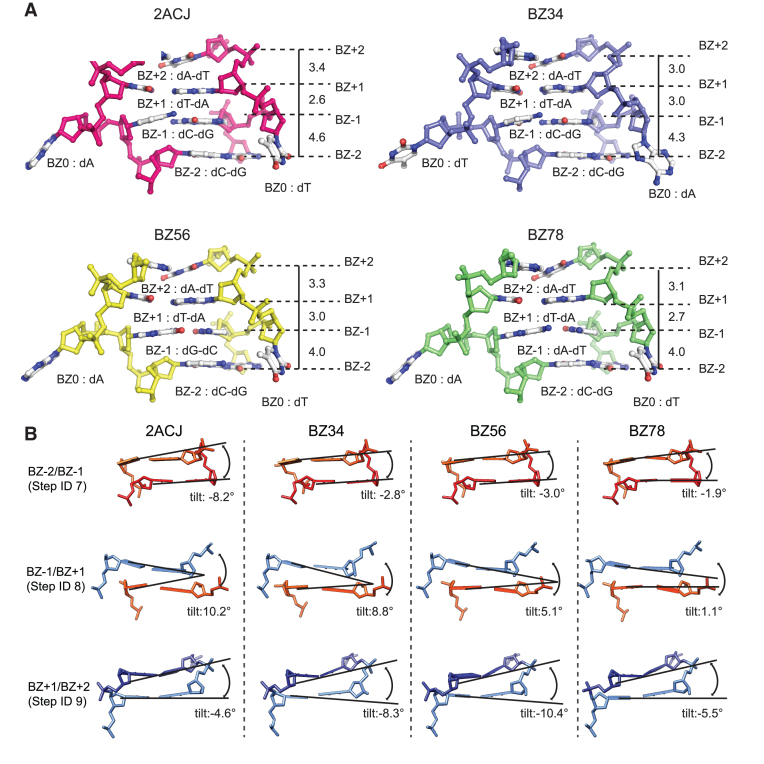
Structural heterogeneity near the BZ junction. (A) The phosphate backbone, sugar and bases near the BZ junction of 2ACJ, BZ34, BZ56 and BZ78 are represented by ball-and-stick models. 2ACJ, BZ34, BZ56 and BZ78 are shown in magenta, blue, yellow and green colors, respectively, and are labeled. The base positions near the BZ junction are labeled as BZ-2, BZ-1, BZ0, BZ+1 and BZ+2. The bases at each position are labeled by position number. The rise base step parameters are shown in Å scale. (B) The side views of BZ-2/BZ-1 (Step ID 7), BZ-1/BZ+1 (Step ID 8) and BZ+1/BZ+2 (Step ID 9) of 2ACJ, BZ34, BZ56 and BZ78 are represented by stick models. BZ-2, BZ-1, BZ+1 and BZ+2 are colored red, light orange, light blue and dark blue, respectively. The tilt angles at each step are represented by black solid lines and are labeled.

