Figure 4.
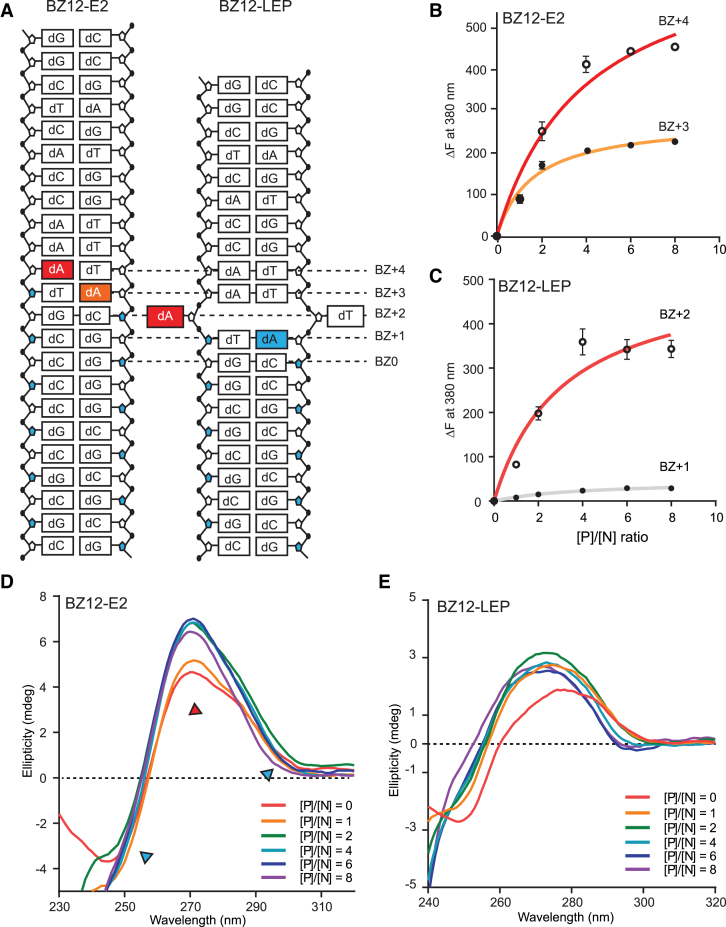
BZ junction formation and B-to-Z transition of BZ12-E2 and BZ12-LEP. (A) Schematic drawing of 2AP-modified BZ-E2 and BZ12-LEP ODNs. 2AP at BZ+3 and BZ+4 positions of BZ12-E2 are colored in orange and red, respectively. The 2AP-substituted adenines at BZ+1 and BZ+2 positions of BZ12-LEP are represented by blue and red colored boxes, respectively. (B) The fluorescent intensity changes (ΔF) at 380 nm of 2AP-labeled BZ12-E2 (BZ+3) and BZ12-E2 (BZ+4) are represented by closed and open circles, respectively, and the regressions are represented by orange and red solid lines, respectively. (C) Fluorescence intensity changes (ΔF) at 380 nm of 2AP-labeled BZ12-LEP (BZ+1) and BZ12-LEP (BZ+2) are indicated by closed black and open circles, respectively, and the regressions are shown by gray and red solid lines, respectively. The ratios between protein and DNA ([P]/[N] ratio) were 0, 1, 2, 4, 6 and 8, where [P]/[N] stands for the molar ratio of protein (hZαADAR1) over DNA. (D) CD spectra of BZ12-E2 upon adding hZαADAR1 at a [P]/[N] ratio from 0 to 8. The spectra bands, which indicate Z-DNA features, are represented by a blue triangle (255 and 292 nm). The spectrum band showing the most significant changes at 270 nm is represented by a red triangle. (E) CD spectra of BZ12-LEP ODN upon adding hZαADAR1 for [P]/[N] ratios of 0–8.

