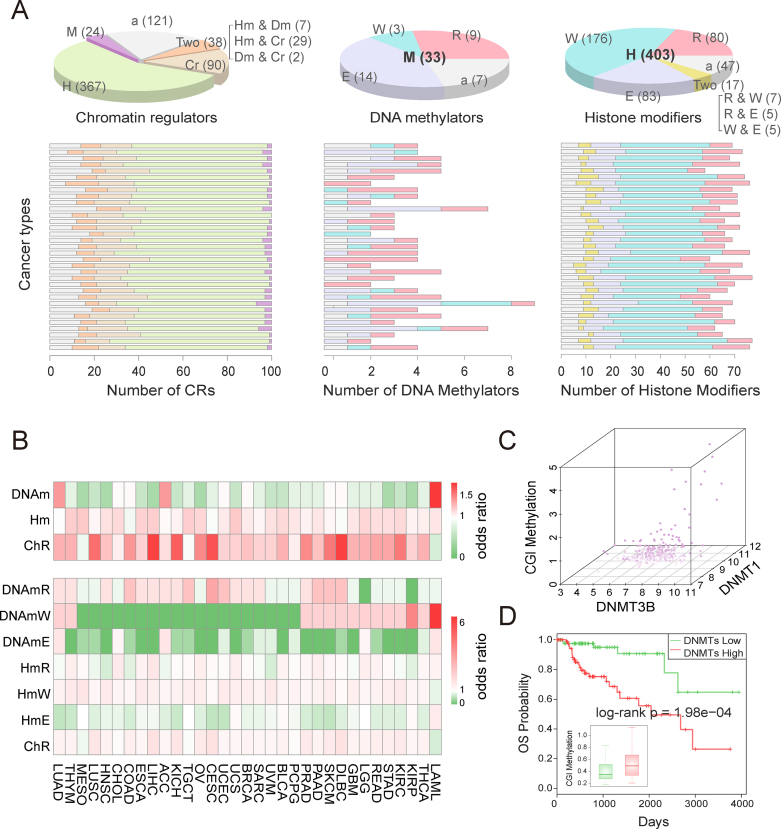
Figure 3.
Epigenetic category of functional CRs across cancer types. (A) Pie charts show the numbers of CRs in different categories, and bar charts show the numbers of CRs in different categories across cancer types. The cancers in bar charts are ordered as in Figure 2A. ‘M’ represents DNA methylator, ‘H’ represents histone modifier, ‘Cr’ represents chromatin remodeler, ‘Two’ represents two types, ‘a’ means ambiguous, ‘R’ represents reader, ‘W’ represents writer and ‘E’ represents eraser. (B) The odds ratios for different categories of CRs across cancer types. The cancer type abbreviations are those used by TCGA. (C) The CGI methylation in KIRP tumor samples is proportional to the expression of DNMT1 and DNMT3B. Darker color represents higher expression. (D) Two groups of KIRP samples distinguished by the expression of DNMT1 and DNMT3B show significantly different CGI methylation and different survival rates.

