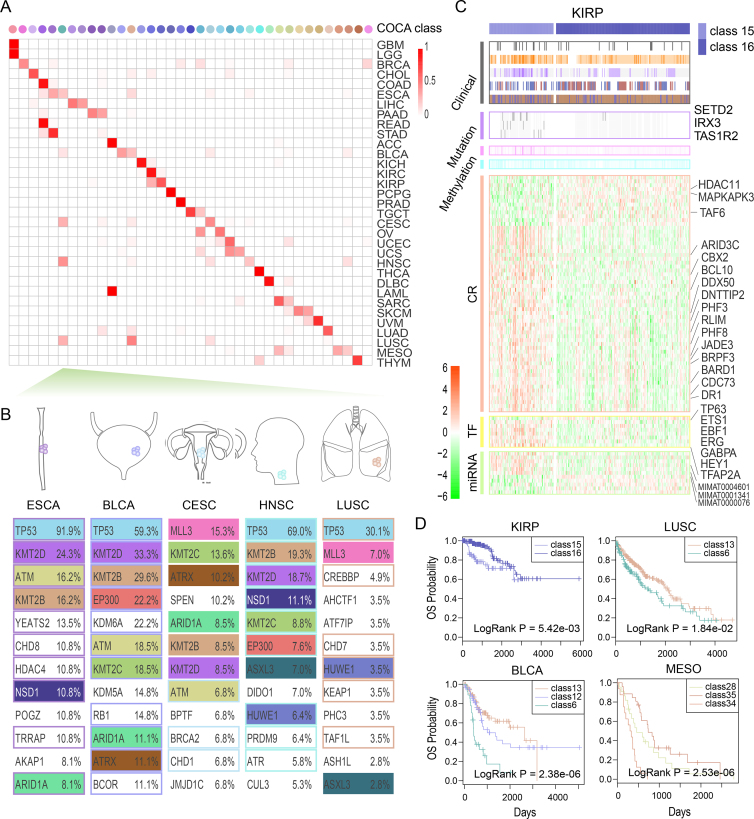
Figure 7.
The reclassified molecular subtypes of pan-cancer patients. (A) Comparison between the COCA reclassified types and the tissue-of-origin types for pan-cancer samples. The colors of COCA classes are explained in Supplementary Figure S16. (B) The top 12 genes mutated in the tumor types, which are converted into class 6. Mutations shared across tumor entities are depicted by colored boxes. Functional CRs are marked with colored borders. (C) The differential molecular patterns and clinical behaviors between KIRP samples in class 15 and those in class 16. KIRP-specific CRs and related TFs/miRNAs are marked. (D) The clinical outcomes for KIRP, LUSC, BLCA, and MESO samples in different COCA classes. Detailed legends are shown in Supplementary Figure S16.

