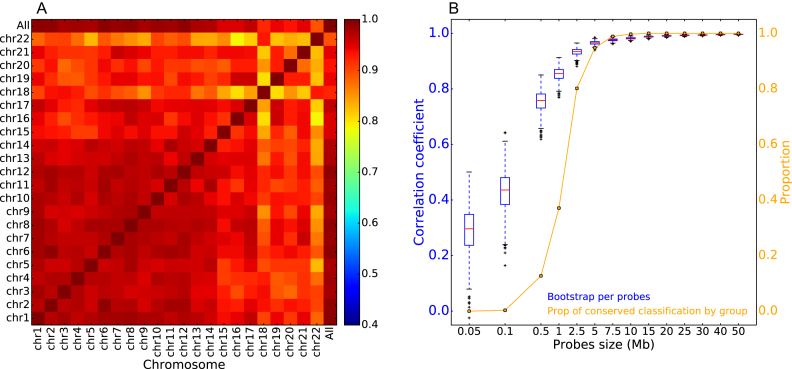
Figure 3.
Replication changes between cell lines are widespread through the genome. (A) Correlation coefficients between the global genome correlation matrix between RFD profiles shown in Figure 2A and the individual chromosomes' correlation matrices shown in Supplementary Figure S5. Pearson correlation coefficient values are colour-coded from blue (0.4) to red (1.0) using the colour bar on the right. (B) Random 5 Mb probes are sufficient to recover the cell line classification. Blue, boxplot of the distribution of the correlation coefficient between the global matrix shown in Figure 2A and random probes of indicated scale (Mb) consisting of 5–5000 randomly located 10 kb windows. Orange, probability of observing the same three-group classification of cell lines as in Figure 2A.

