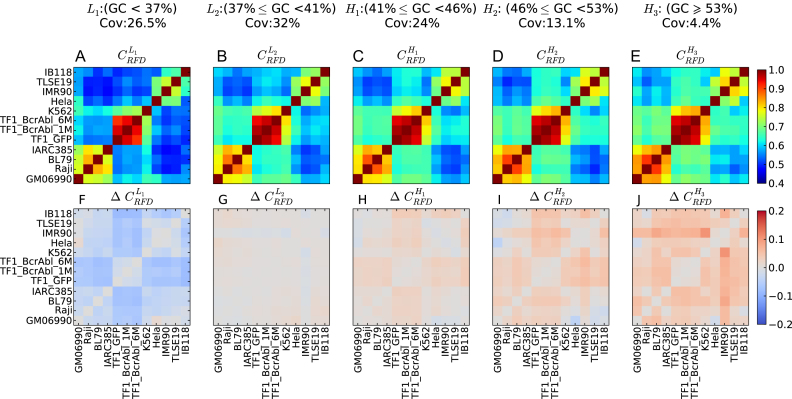
Figure 4.
RFD profiles are more conserved in high GC-content regions. (A–E) Correlation matrix of RFD profiles depending on the GC content; 10 kb windows were grouped in GC-content categories following the 5 isochores classification of the human genome in light isochores L1 (GC < 37% ;  ; A) and L2 (37% ≤ GC < 41% ;
  ; B), and heavy isochores H1 (41% ≤ GC < 46% ;
  ; C), H2 (46% ≤ GC < 53% ;
  ; D) and H3 (GC ≥ 53% ;
  ; E); coverage (Cov) of the sequenced human genome by each isochore family is provided in the header of each column; Pearson correlation coefficient values are colour-coded from blue (0.4) to red (1.0) using the color bar on the right (Materials and Methods). (F-J) Matrices of correlation differences
  where I can be L1, L2, H1, H2 or H3; correlation difference values are colour coded blue (resp. red) for negative (resp. positive) differences using the color bar on the right; a blue (resp. red) colour indicates that RFD profiles are less (resp. more) conserved in the considered isochore than in the 22 autosomes. Matrices row and column order is the same as in Figure 2A.

