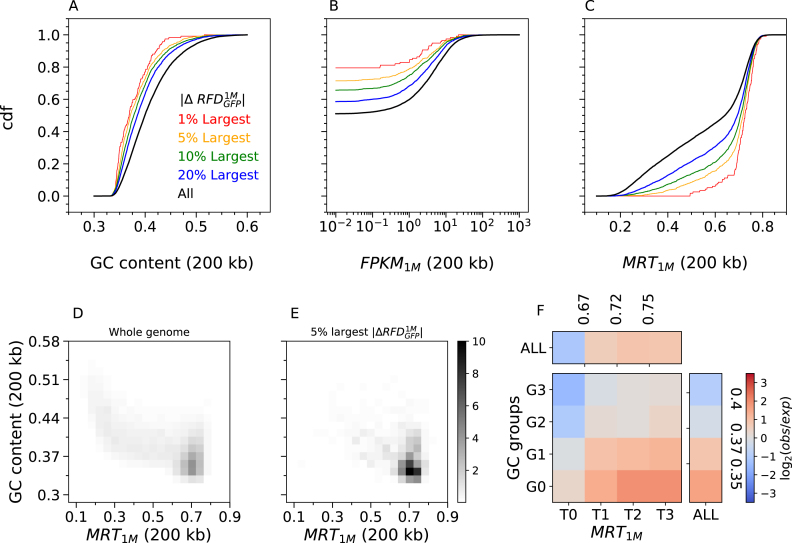
Figure 5.
The largest RFD changes induced by 1 month of BCR-ABL1 expression are observed in GC-poor, lowly-expressed and late replicating regions. Cumulative distribution functions (cdf) of GC content (A), transcription in TF1-BrcAbl-1M (FPKM1M) (B) and MRT in TF1-BrcAbl-1M (C) computed in non-overlapping 200 kb windows of the 22 autosomes (Materials and Methods). Cdfs were determined for all windows (all, black) or selected windows with the 20% (blue), 10% (green), 5% (yellow) and 1% (red) largest RFD changes between TF1-GFP and TF1-BrcAbl-1M ( ). Similar results are observed after 6 months of induced BCR-ABL1 expression (Supplementary Figure S10). (D,E) 2D-histograms of GC content vs. MRT (computed in 200 kb windows) of the whole genome (D) or the 5% largest RFD changes following 1 month of BCR-ABL expression. (E) Fold-enrichment of the 5% largest RFD changes after subdividing the genomic bins in four MRT classes (MRT ≤ 0.67; 0.67 < MRT ≤0.718; 0.718 < MRT ≤ 0.75; and MRT > 0.75) and four GC content classes (GC ≤ 0.35; 0.35 < GC ≤ 0.37; 0.37 < GC ≤ 0.4; and GC > 0.4). These subdivisions correspond to quartiles of each parameter distribution for the windows of largest RFD changes, which ensures that each of the 16 bins contains sufficient data for statistically meaningful comparison.

