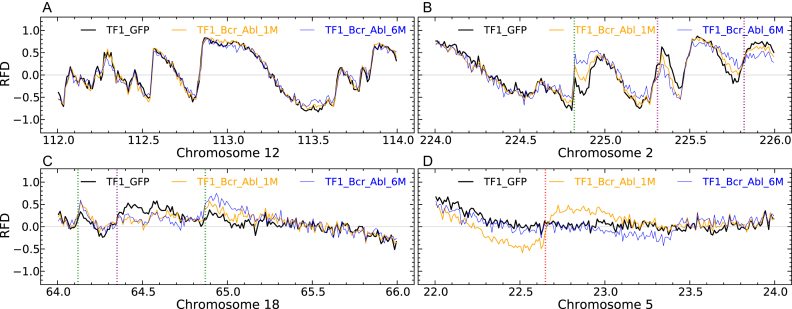
Figure 6.
Manual annotation of RFD profile changes during the first two steps of the CML progression model. (A–D) RFD profiles computed in 10 kb non-overlapping windows for TF1-GFP (black), TF1-BrcAbl-1M (yellow) and TF1-BrcAbl-6M (blue) are visualised in 2 Mb regions along the 22 human autosomes. (A) Region along chromosome 12 where RFD profiles in the 3 cell lines do not present any significant difference. (B) Region along chromosome 2 illustrating IZs whose efficiency is repeatedly enhanced (green) or weakened (purple) in Steps 1 and 2 of the model CML progression. (C) Region along chromosome 18 having two IZ efficiency changes in Step 1 (enhanced, leftmost green; weakened, purple) that are confirmed in Step 2. The rightmost green line marks an IZ which is repeatedly enhanced at Steps 1 and 2 (as in B). (D) Region along chromosome 5 illustrating an IZ activated during Step 1 (red line) and silenced during Step 2.

