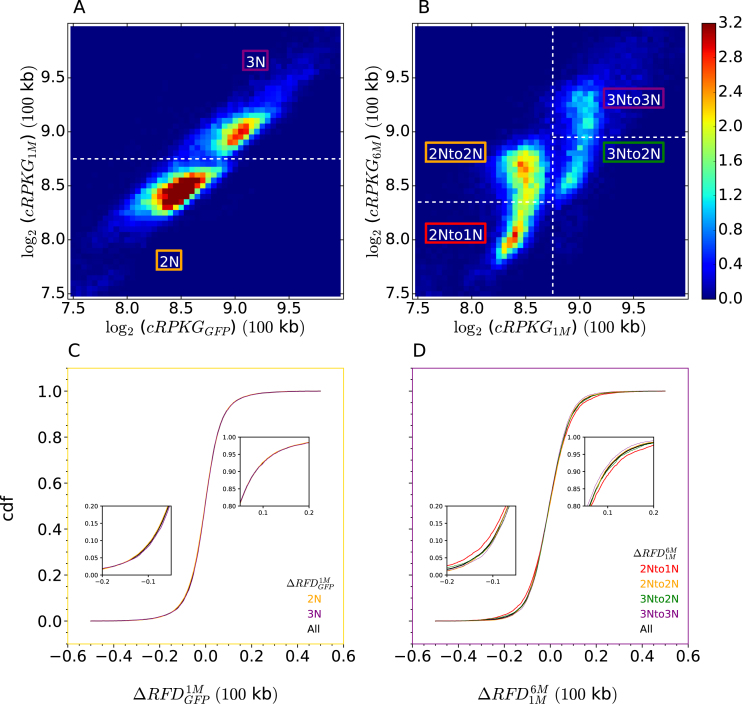
Figure 9.
BCR-ABL1 induces genomic deletions associated with replication changes. (A, B) 2D histograms of OK-seq coverage (log2(cRPKG)) in TF1-BCRABL-1M versus TF1-GFP (A) and TF1-BCRABL-6M vs. TF1-BCRABL-1M (B). Stable and unstable diploid and triploid regions are outlined. Normalized histogram values are colour-coded from blue (0.0) to red (3.2) using the colour bar on the right. (C, D) Cdfs of Step 1 (C) and Step 2 (D) RFD changes in indicated regions of panels A and B. Regions where cdfs separate in panel D are enlarged (insets).

