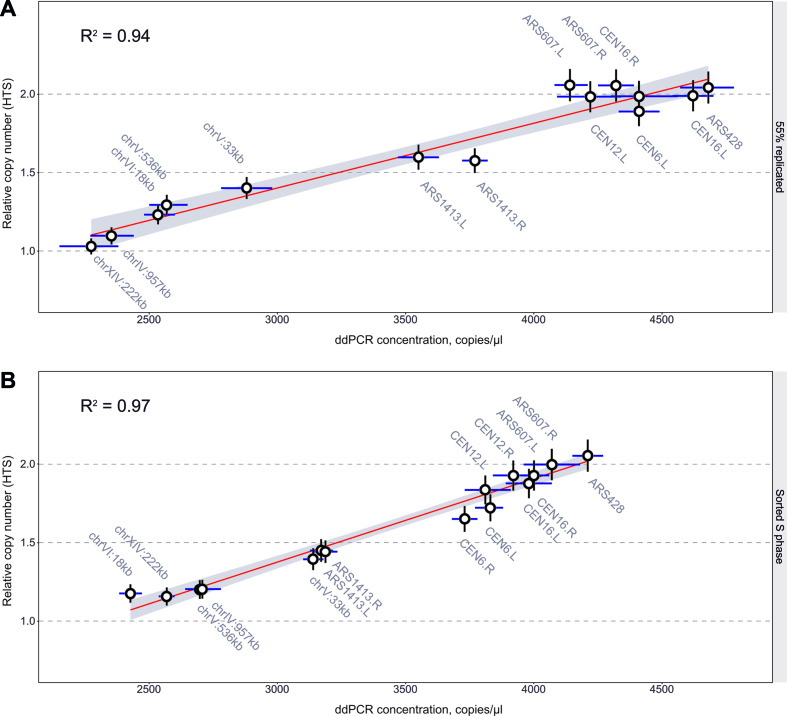
Figure 2.
Comparison of ddPCR and HTS-based methods. (A) Linear fit between absolute DNA concentrations measured by ddPCR and HTS (1) from cell-cycle synchronized S phase haploid cells (T7107) with ∼55% bulk genome replication. (B) Linear fit between absolute DNA concentration measured by ddPCR and HTS (1) from FACS-enriched S phase diploid cells (T9475). Error bars, HTS: estimated 5% coefficient of variation; ddPCR: 95% CI based on 3 technical replicates.

