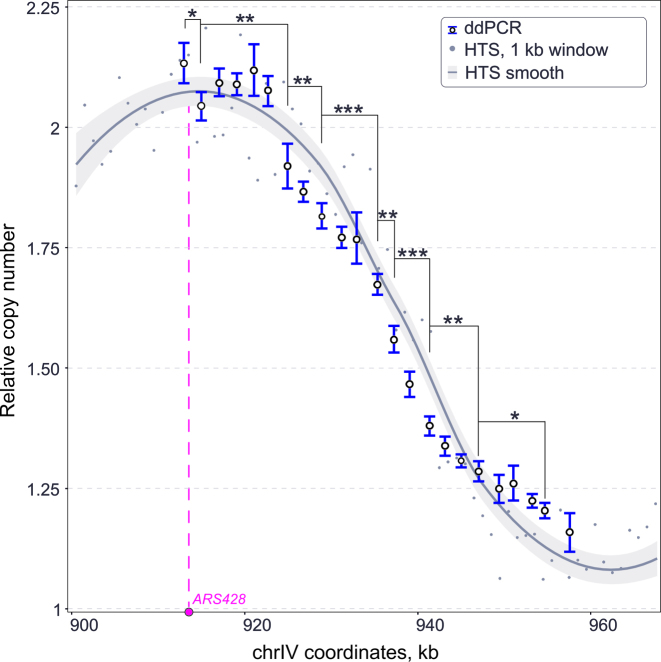
Figure 3.
Resolution of ddPCR for measurement of DNA replication timing. Comparison of relative DNA concentrations measured by ddPCR and HTS (1) for the genomic region including ARS428, as indicated on the x-axis. Both datasets are from cell-cycle synchronized S phase haploid cells (T7107) with ∼55% bulk genome replication. The HTS data is shown with and without smoothing. The ddPCR data error bars are 95% CI based on technical replicates. HTS data is smoothed using LOESS local regression, shown with 0.95 confidence interval. Asterisks denote significance in ANOVA followed by Tukey HSD test (*P-value ≤ 0.05, **P-value ≤ 0.01, ***P-value ≤ 0.001).

