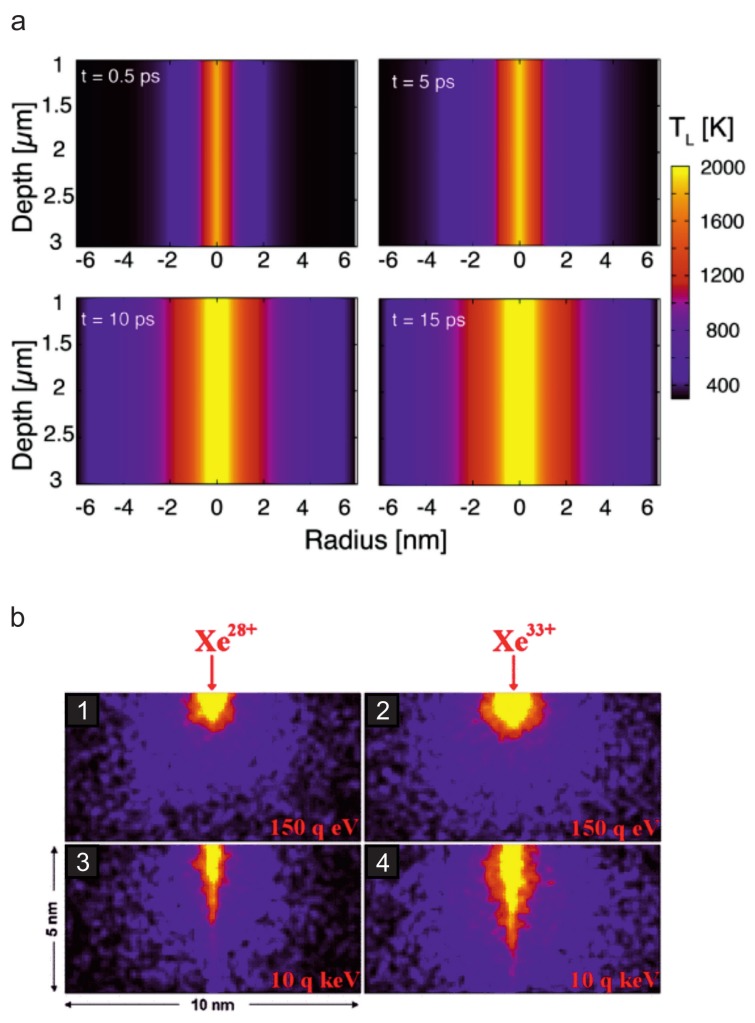
Figure 2.
Evolution of the lattice temperatures due to ion impact calculated with the two temperature model showing the different depths of energy deposition of SHI and HCI. (a) Lattice temperatures for an SHI (11.4 MeV/amu Ca with keV/nm) traversing crystalline SiO. From Ref. [43]. © IOP Publishing. Reproduced with permission. All rights reserved. (b) Lattice temperatures for an HCI (Xe and Xe) in CaF for two different kinetic energies (150 eV and 10 keV). Reprinted with permission from Ref. [44], Copyright (2011) by the American Physical Society. Note the different z-scales for the two different ion types.

