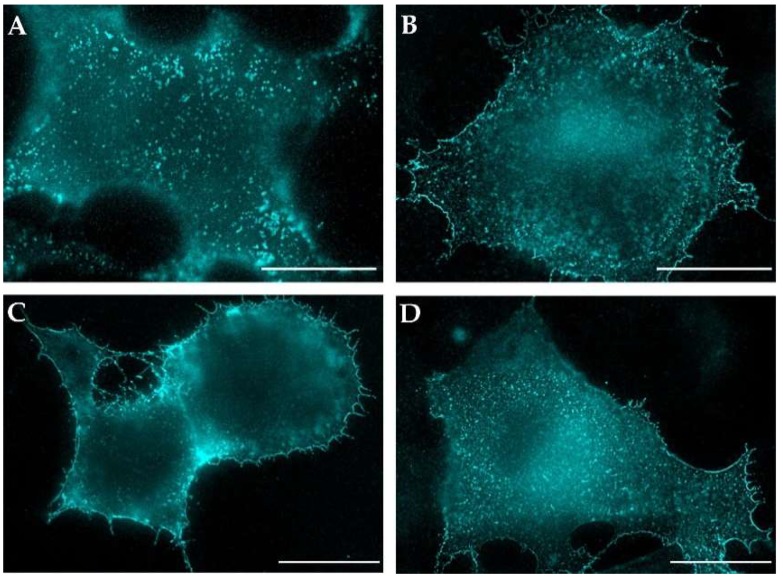
Figure 4.
Plasma membrane distribution of M-PMV Env. The COS-1 cells were either transfected with plasmids encoding M-PMV genomic DNA with: WT Env (pSARMX-WT; panel A), I18A Env (pSARMX-I18A; panel B), or Y22A Env (pSARMX-Y22A; panel C) or an M-PMV Env expression vector (pTMT-WT; panel D). 48 h post-transfection cells were incubated with goat anti-M-PMV antibody on ice for 25 min to bind surface exposed M-PMV Env. Formaldehyde (4%) fixed cells were immunostained for CA protein with rabbit anti-CA antibody (except for the cells transfected with pTMT-WT,). Env was visualized using secondary anti-goat IgG antibody conjugated with Alexa Fluor® 350. Samples were mounted in Vectashield mounting media and imaged on an Olympus cell^R microscope. The original blue color of the AF350 signal was changed to cyan for increased contrast. Magnification 600×; scale bars 20 µm.

