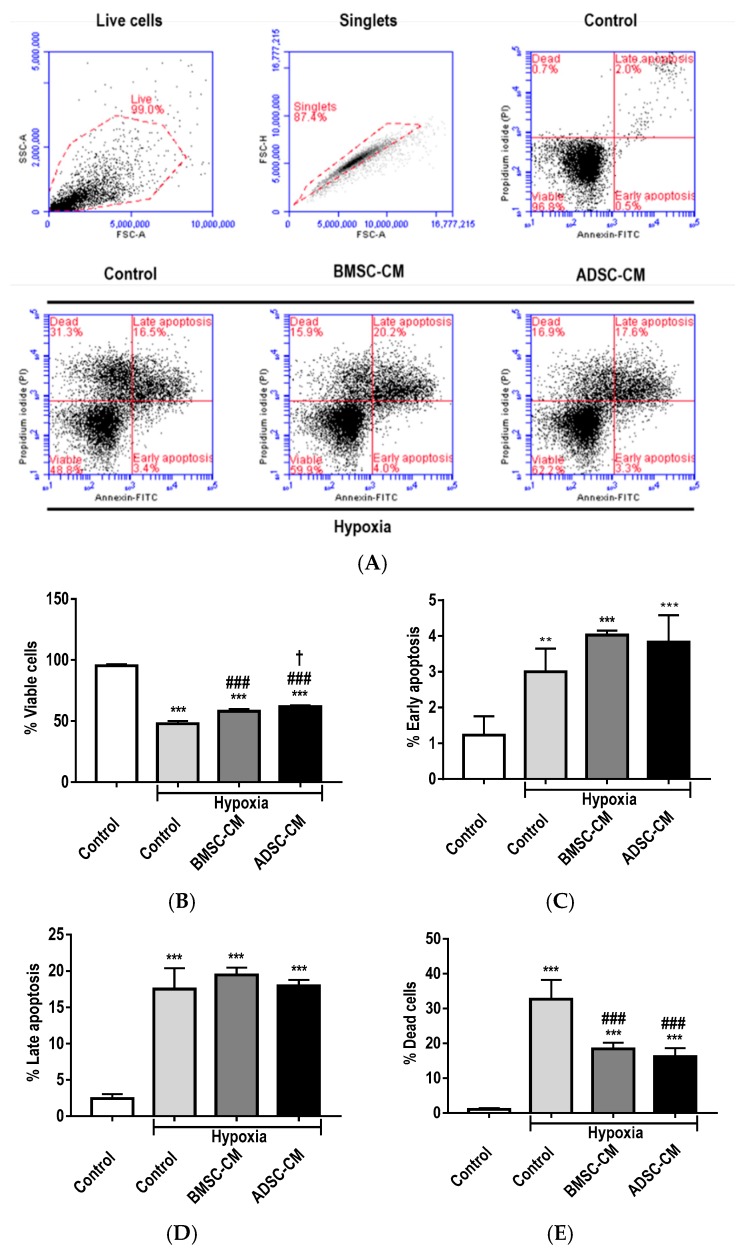
Figure 1.
(A) Flow cytometry analysis of primary rat AECs treated with human MSC-CM during hypoxic (1.5% O2) exposure for 24 h. The percentage of cells in various apoptotic stages, (B) viable cells, (C) early apoptosis, (D) late apoptosis and (E) dead cells were collected from 10,000 single-cell events. Data presented as mean ± SD; n = 3 (* p < 0.05, ** p < 0.01, *** p < 0.001 vs. normoxia control, # p < 0.05 and ### p < 0.001 vs. hypoxia control and † p < 0.05 vs. BMSC-CM). The resulting data were statistically analysed using one-way ANOVA and Tukey’s multiple comparison test.

