Figure 4.
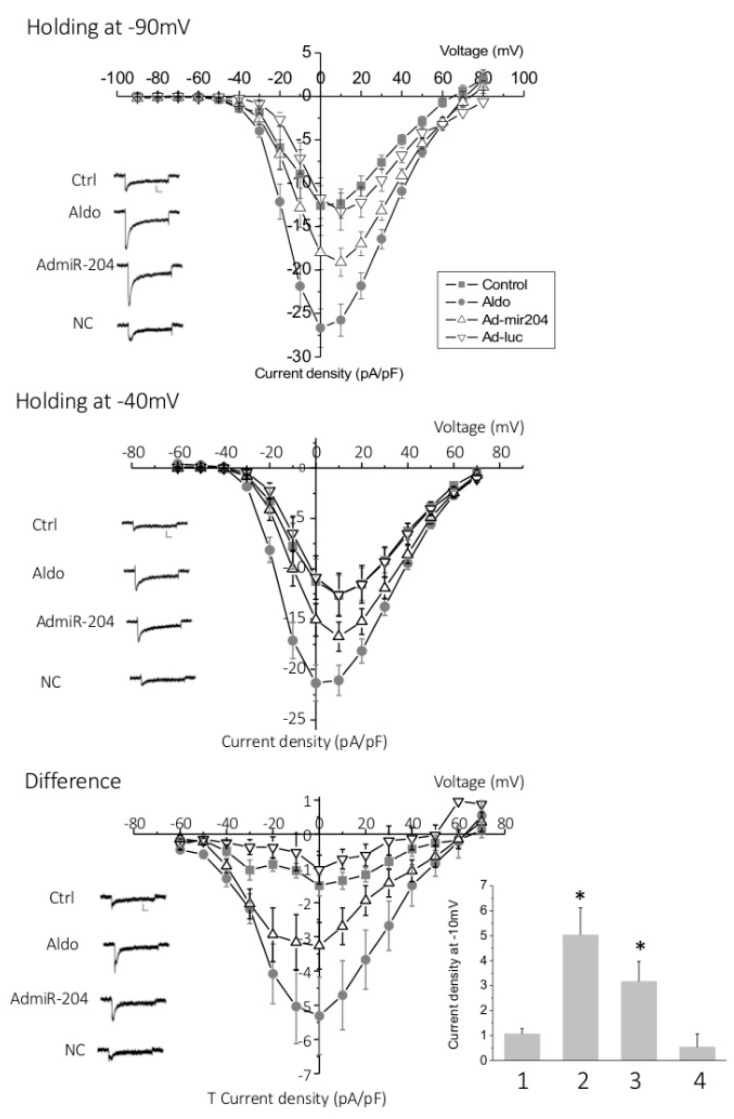
T-type and L-type Ca2+ currents are increased upon miR-204 overexpression. The graphs show the current density-voltage relationship obtained from whole cell patch clamp experiments in control (Ctrl), aldosterone (1 µM for 24 h)-treated (Aldo), miR-204 adenovirus-infected (Admir-204), and luc-adenovirus-infected cardiomyocytes (Ad-luc) obtained from holding potential at −90 mV (upper panel), reflecting the total (L-type and T-type) calcium current, or at −40 mV (middle panel), reflecting L-type current. The difference plots, reflecting T-type Ca2+ currents, are shown in the lower panel. Traces are representative examples of current recordings at –20 mV depolarization steps. Scale bars are 100 pA (vertical) and 25 ms (horizontal). Data are means ± SEMs (n = 11–16). The bar graph represents the means + SEMs of the T current density recorded at −10 mV in control (1), aldosterone (1 µM for 24 h)-treated (2), miR-204 adenovirus-infected (3), and luc-adenovirus-infected (4) cardiomyocytes (* p < 0.05).

