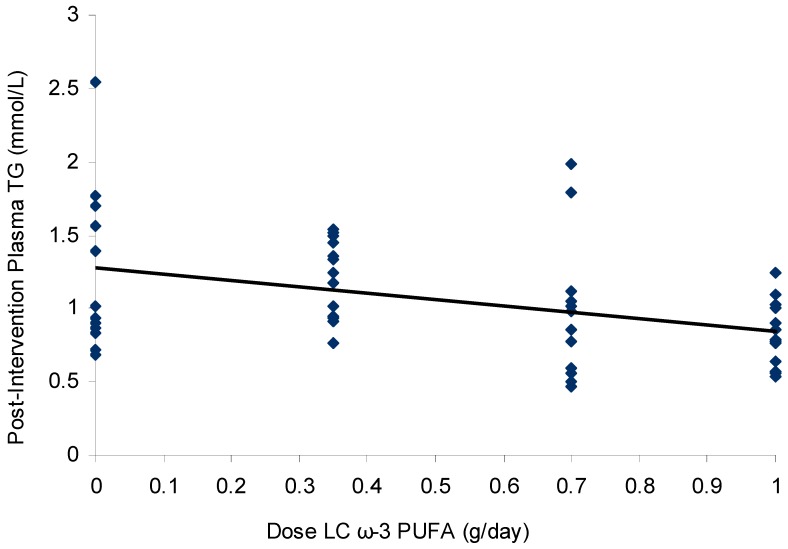
Figure 3.
Scatterplot (with linear regression line) of plasma triglyceride levels (mmol/L) following supplementation with 0, 0.35, 0.7, and 1 g/day n-3 LCPUFA from HiDHA™ tuna oil (n = 53). R2 = 0.16, p = 0.003 in the per-protocol analysis. 0 g/day group n = 12; 0.35 g/day group n = 15; 0.7 g/day group n = 13; 1.0 g/day group n = 13.

