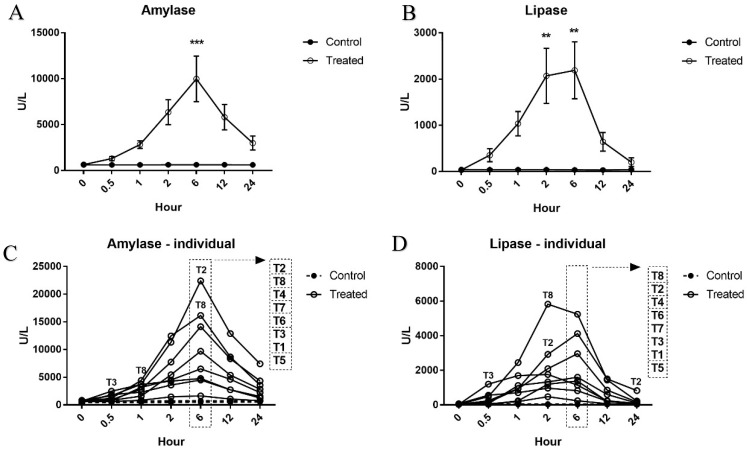
Figure 1.
Time-course changes in mean and individual serum amylase and lipase levels. (A) amylase; (B) lipase; (C) amylase–individual; (D). lipase–individual. Absolute values (U/L) of serum amylase and lipase levels are shown as mean ± standard error. In each individual graph, the order of response of individual animals at the 6 h time point is shown in a dotted rectangle. ** p < 0.01 and *** p < 0.001 compared to vehicle controls.

