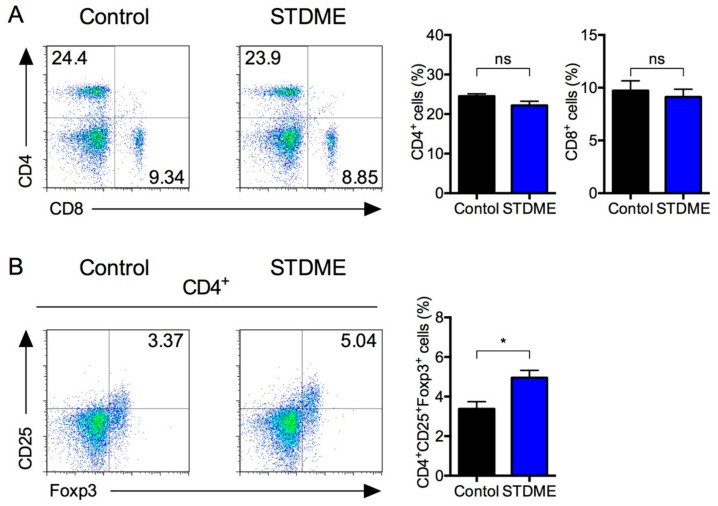
Figure 4.
Splenic T cell subsets in STDME-fed mice after induction of AOM/DSS-induced CAC. Splenocytes from control or STDME-fed CAC-induced mice were isolated. Representative dot plot of CD4+, CD8+ and CD4+CD25+Foxp3+ splenocytes analyzed by flow cytometry. Each bar represents the mean ± SEM and the data were assessed by a Mann-Whitney U-test. * p < 0.05; ns = not significant; n = 10/group. STDME, selenoneine-containing tuna dark muscle extract.

