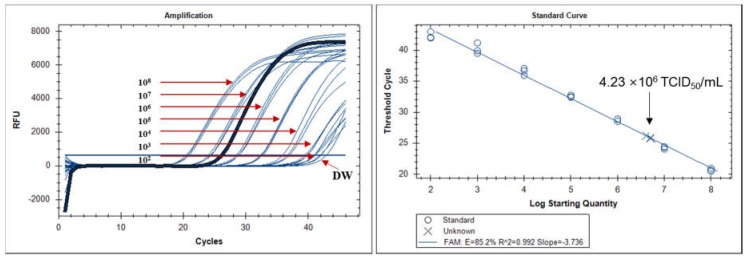
Figure 6.
Assessment of fluorescent immunochromatographic strip test (FICT) performance by qRT-PCR. The linear relationship between the cycle threshold (Ct) and RNA copy number of respiratory syncytial virus (RSV) nucleoprotein (NP) was used to produce a standard curve (left panel). The right panel indicates the Ct value (Y-axis) and the RNA copy numbers (X-axis) at a virus titer (4.23 × 10⁶ TCID50/mL) corresponding to the limit of detection of the FICT.

