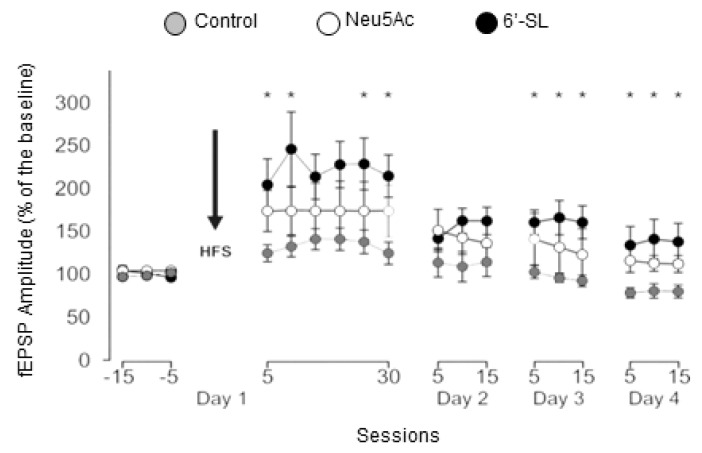
Figure 3.
Experimentally-evoked LTP in the groups of animals at one year of age. Data collected from the three groups of animals before and after high-frequency stimulation (HFS) session (indicated by the downward arrow). The HFS was presented after 15 min of baseline recordings. LTP evolution was followed for up to four days. Statistical differences between groups were determined with a two-way repeated measure of the analysis of variance (ANOVA). The three groups of animals presented a significant (p ≤ 0.05) LTP in relation with baseline values. In addition, field excitatory post-synaptic potential (fEPSP) values evoked after the HFS session were significantly larger (*, p ≤ 0.05) for the 6′-SL group in comparison with values collected from controls. Data are represented as the mean ± SEM (n = 10 animals/group). Neu5Ac, N-acetylneuraminic acid; 6′-SL, 6′-sialyllactose.

