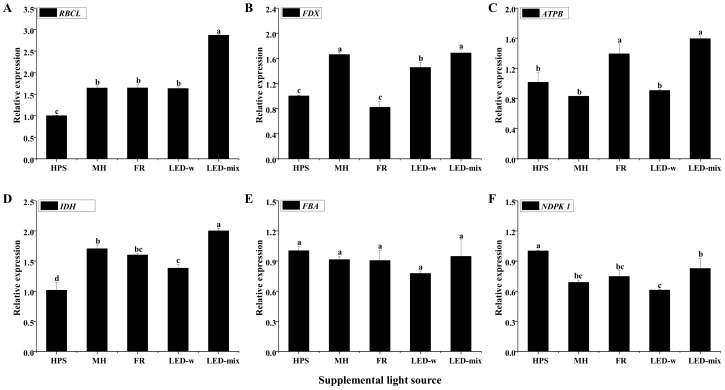
Figure 6.
The relative gene expression of ribulose bisphosphate carboxylase large chain (RBCL) (A), ferredoxin (FDX) (B), ATP synthase subunit β (ATPB) (C), isocitrate dehydrogenase (IDH) (D), fructose-bisphosphate aldolase (FBA) (E), and nucleoside diphosphate kinase 1 (NDPK 1) (F). Different small letters indicate the significant separation within treatments by Duncan’s multiple range test at a 0.05 level.

