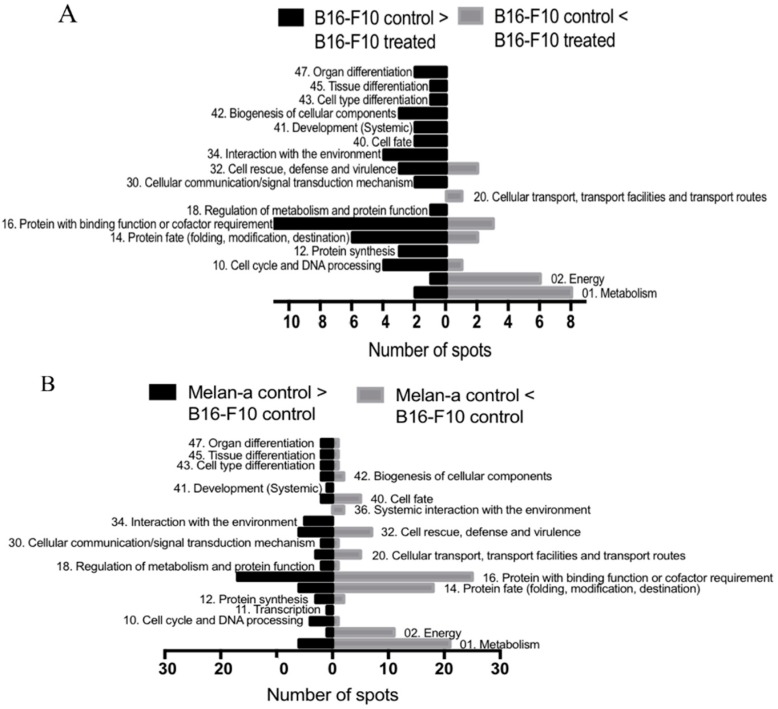
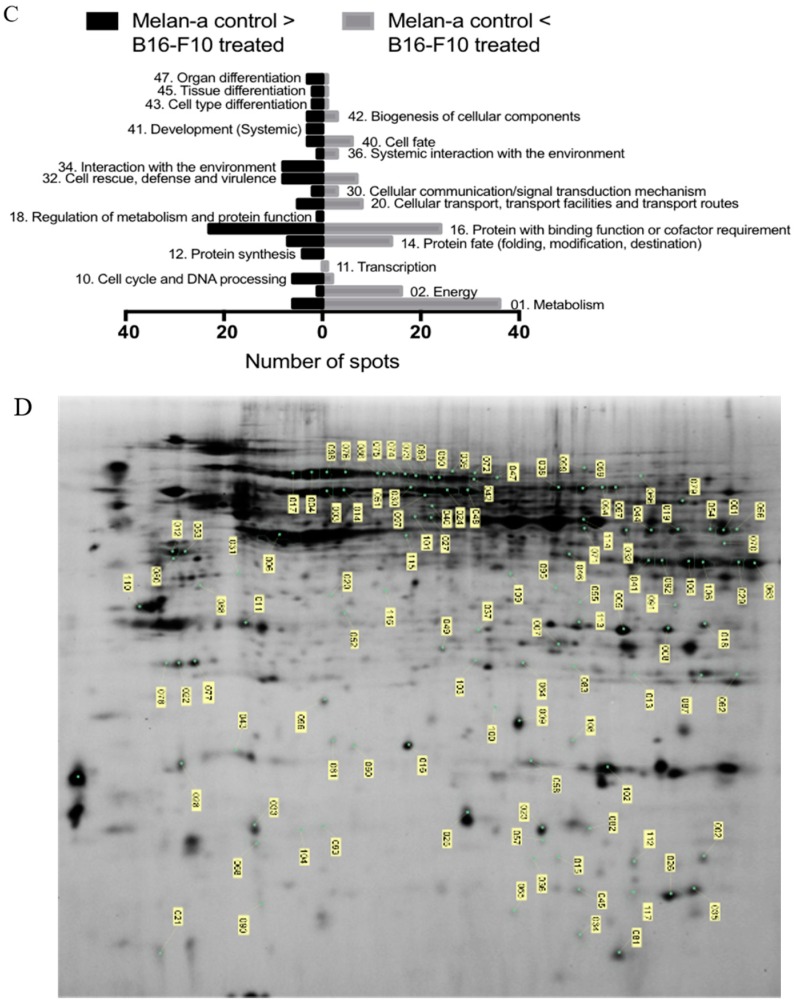
Figure 3.
Proteomic analysis of B16-F10 and Melan-a cells treated with CMS-2 including functional assignment of identified proteins: (A) comparison between B16-F10 control and treated; (B) comparison of Melan-a control to B16-F10 control; and (C) comparison between Melan-a control and B16-F10 treated. Exactly 10 µg/mL was added to treated cells. Protein functional classification was based on FunCat (http://mips.helmholtz-muenchen.de/genre/proj/mfungd/index.html) database. (D) Image of two-dimensional Difference Gel Electrophoresis (DIGE) (SDS-PAGE 12%, strips IPG 24 cm, pH 3−11 nonlinear) representing an overlay of six gels used to analyzed the protein extracts from B16-F10 control, B16-F10 treated, Melan-a control and Melan-a treated. The spots labeled in this composite image includes all the selected spots for the analysis.


