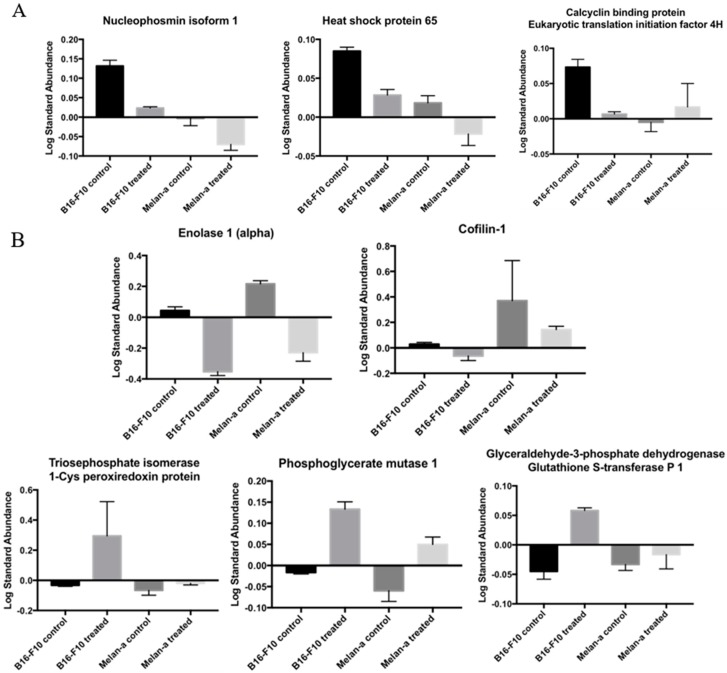
Figure 4.
Groups of proteins whose expressions were statistically altered by CMS-2 treatment: (A) Group 1 includes proteins whose expression was initially increased in B16-F10 (control) but after CMS-2 treatment normalized their expression (became similar to Melan-a control); and (B) Group 2 includes proteins which after CMS-2 treatment altered the expression in both cell lines (similar expression in Melan-a control and B16-F10 control but different expression compared to B16-F10 treated).

