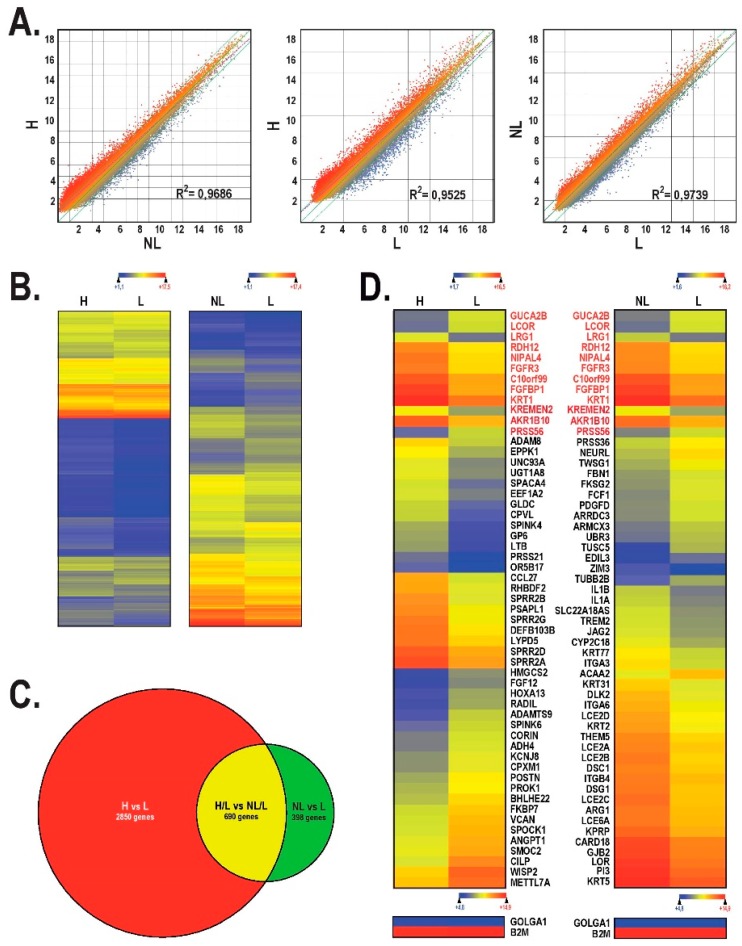
Figure 3.
Microarray analysis. (A) Scatter plot of log2 of signal intensity from 60,000 different targets covering the entire human transcriptome of healthy or non-lesional tissue-engineered skin substitutes (in the y-axis) against non-lesional (first graph) or lesional (last two graphs) (in the x-axis). (B) Heatmap representation of genes whose expression is differentially regulated by at least two-fold in healthy against lesional substitutes and in non-lesional against lesional substitutes. (C) Venn diagram that indicates the number of deregulated genes in healthy against lesional substitutes (red circle) and in non-lesional against lesional substitutes (green circle). Genes that are commonly deregulated between these two groups are indicated in yellow. (D) Heatmap representation of the 55 most deregulated genes expressed by lesional substitutes relative to healthy substitutes (left) and non-lesional substitutes against lesional substitutes (right). The most highly expressed genes are shown in red, while the most weakly expressed are in blue. The genes with red writing are those identified as similarly deregulated between the two heatmaps. H: healthy; L: lesional; NL: non-lesional.

