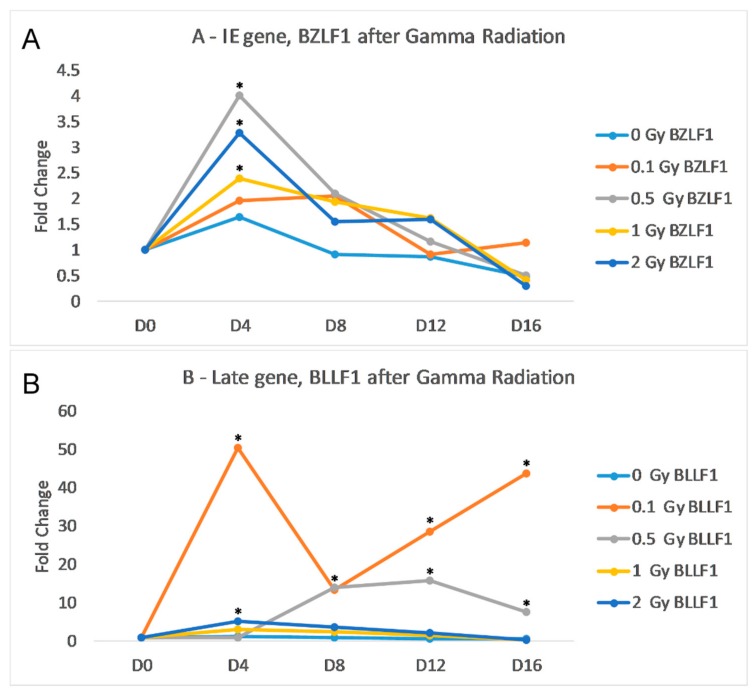
Figure 1.
Effects of gamma radiation on Akata cells. Cells were radiated with 0.1 Gy (orange), 0.5 Gy (grey), 1 Gy (yellow) or 2 Gy (dark blue), then incubated for 16 days. The control flask (light blue) was not irradiated. (A) Fold change of IE gene BZLF1 transcripts normalized to endogenous control GAPDH over time relative to the control. (B) Fold change of L gene BLLF1 transcripts normalized to endogenous control GAPDH over time relative to the control. Statistical significance as compared to no radiation control and (two-tailed t test, * p < 0.05).

