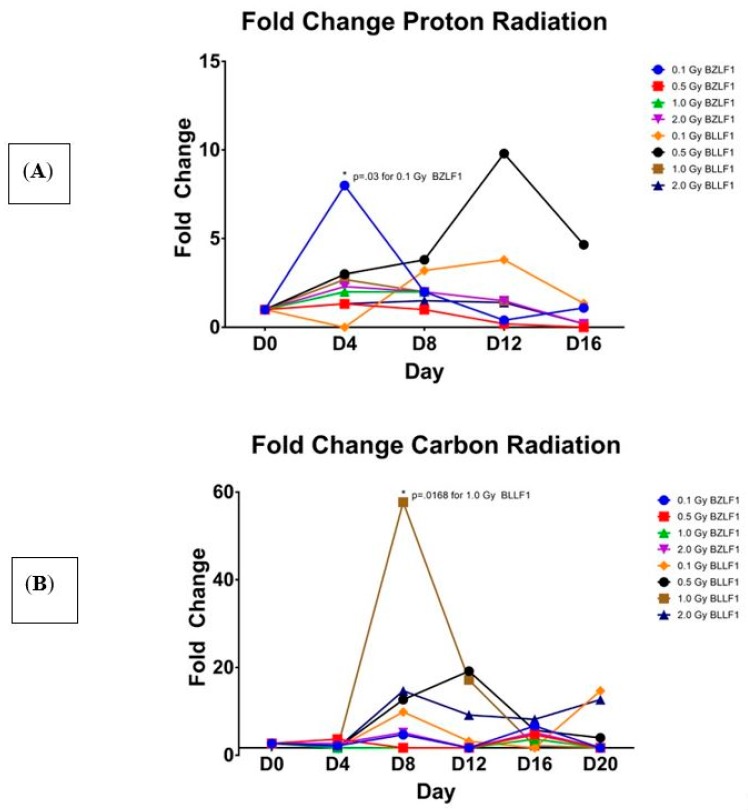
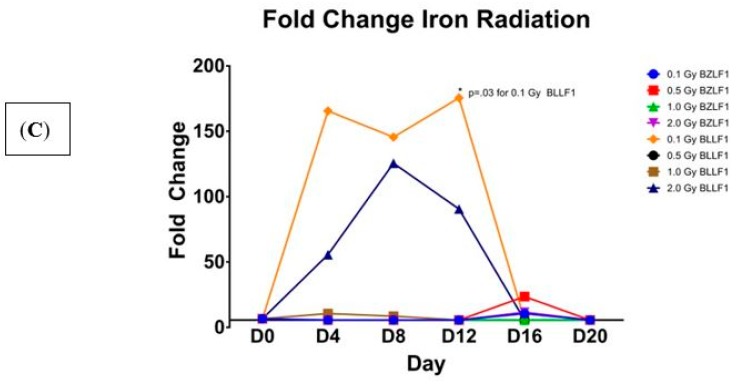
Figure 2.
Fold change in EBV BZLF1 and BLLF1 transcripts over time at various amounts of the three types of radiation, relative to the un-irradiated control. The x axis shows the time point, measured in days, -post-radiation treatment. The y axis shows the fold change in BZLF1 and BLLF1 transcripts. BZLF1 and BLLF1 transcript quantity values divided by the corresponding GAPDH quantity values, with fold change being relative to the un-irradiated controls. Statistical significance as compared to no radiation control (two-tailed t test, * p < 0.05). (A) Proton; (B) carbon, (C) Iron.


