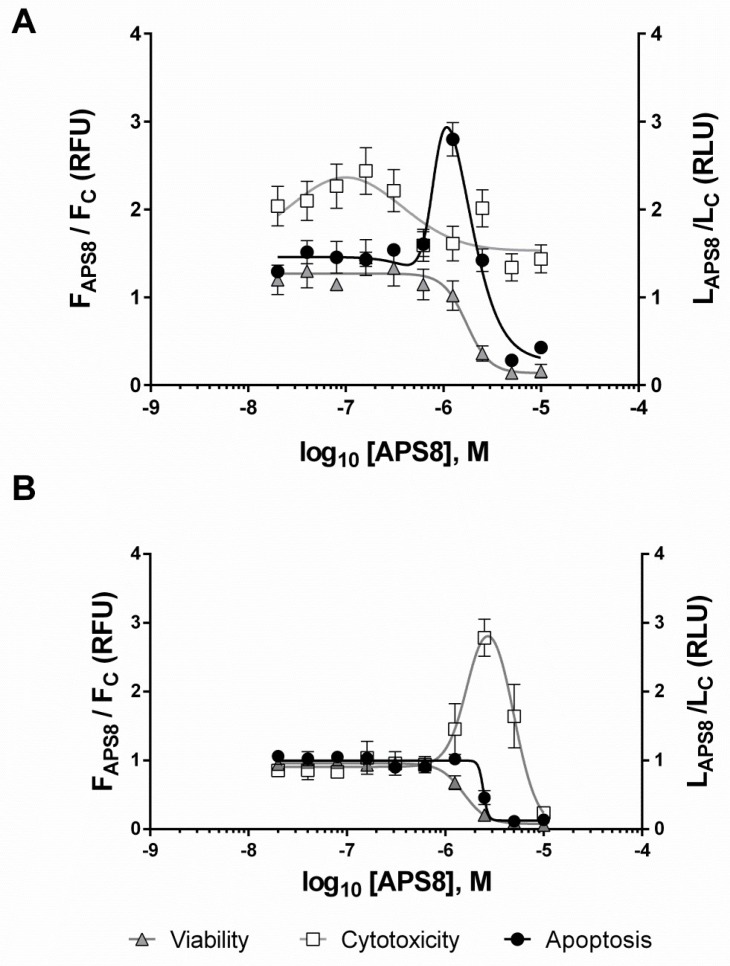
Figure 2.
Dose-response curves for APS8-treated A549 cells (A) and HT29 cells (B). Cell viability and cytotoxicity were measured after 6 h treatment with APS8, while apoptosis was assessed after 8 h. Data are background-corrected means ± SEM (n = 4–8), normalized to the untreated cells. F, fluorescence; L, luminescence.

