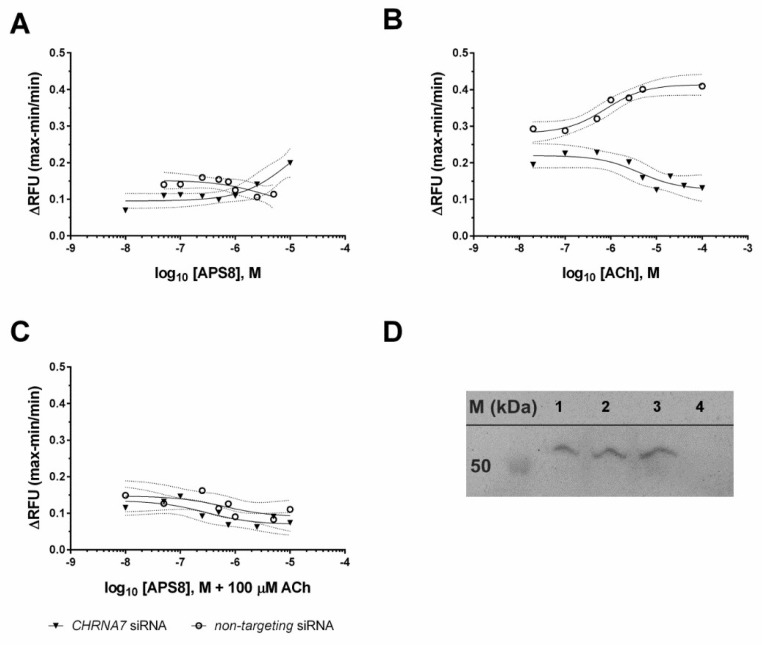
Figure 4.
Dose-response curves of Ca2+ uptake in A549 cells and Western blot panel showing CHRNA7 gene silencing. Cells were treated with various concentrations of APS8 (A; 10, 5, 2.5, 1, 0.75, 0.5, 0.25, 0.1, 0.05, 0.01 µM) or ACh (B; 100, 40, 20, 10, 5, 2.5, 1, 0.5, 0.1, 0.02 µM) or preincubated (20 min, RT) with various concentrations of APS8 and then treated with 100 µM ACh (C). The A549 cells were silenced with CHRNA7-targeted or nontargeting (negative control) siRNAs. Data are relative fluorescence units (RFU), as maximum response minus minimum response, divided by the minimum response. The curves and their 95% confidence intervals were obtained by fitting the data with nonlinear regression function (GraphPad Prism). Recombinant human α7 nAChR (#H00001139-P01, Abnova; Lane 1) and lysates of A549 cells treated with nontargeting siRNA (Lane 2) or siRNA targeting CHRNA7 (Lanes 3 and 4) were separated by SDS-PAGE followed by Western blotting (D) using rabbit antibodies against human α7 nAChR (1:500; #HPA029422, Sigma-Aldrich) and Peroxidase AffiniPure Goat Anti-Rabbit IgG (1:10,000; #111-035-003, Jackson ImmunoResearch Europe Ltd).

