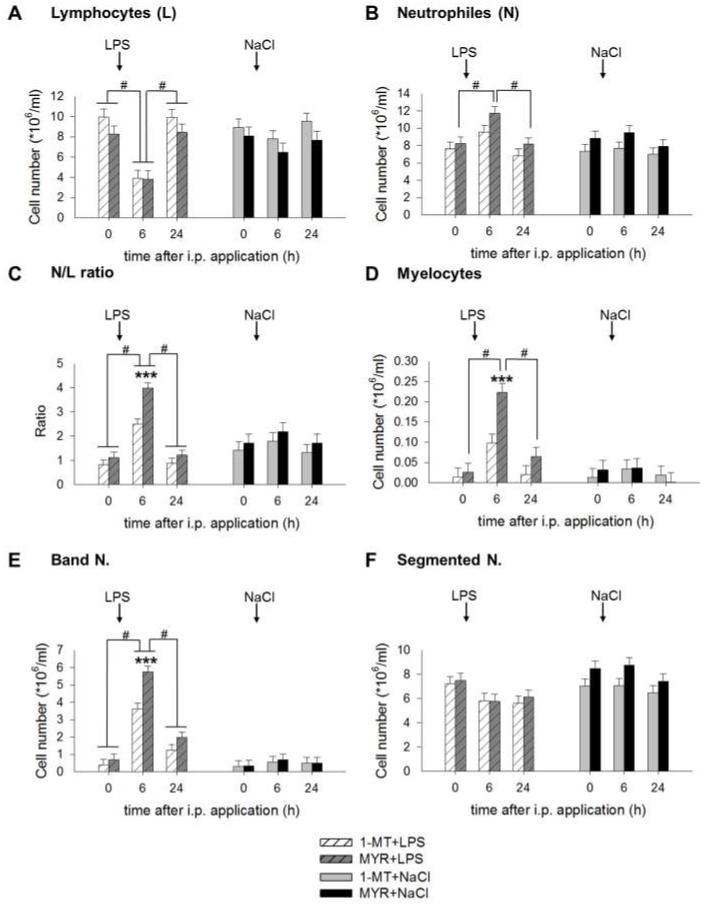
Figure 4.
Effects of LPS on the number of lymphocytes (A), neutrophils (B), N/L ratio (C), myelocytes (D), band neutrophils (E) and segmented neutrophils (F) and its interference by 1-MT. Treatment with NaCl and pre-treatment with MYR were used as control groups. LPS or NaCl were injected i.p. directly after blood sampling at 0 h. The animals received the fifth s.c. 1-MT injection at 12 h after LPS/NaCl treatment to prevent a decline in 1-MT levels during the period of the LPS response. The cell number was measured by differential leukocyte counts using a total of 200 leukocytes per animal and time point. All data are presented as LS-means ± SE. Significant differences between 1-MT- and MYR-pre-treated groups were calculated using the Tukey–Kramer test and are indicated for each time point/period by asterisks. Significant differences between the time points are indicated by hashes within each treatment group. For time points 0 and 6 h: n = 11-12/group (total n = 47); for time point 24 h: n = 5-6/group (total n = 23); *** p < 0.001, # p < 0.01.

