Figure 1.
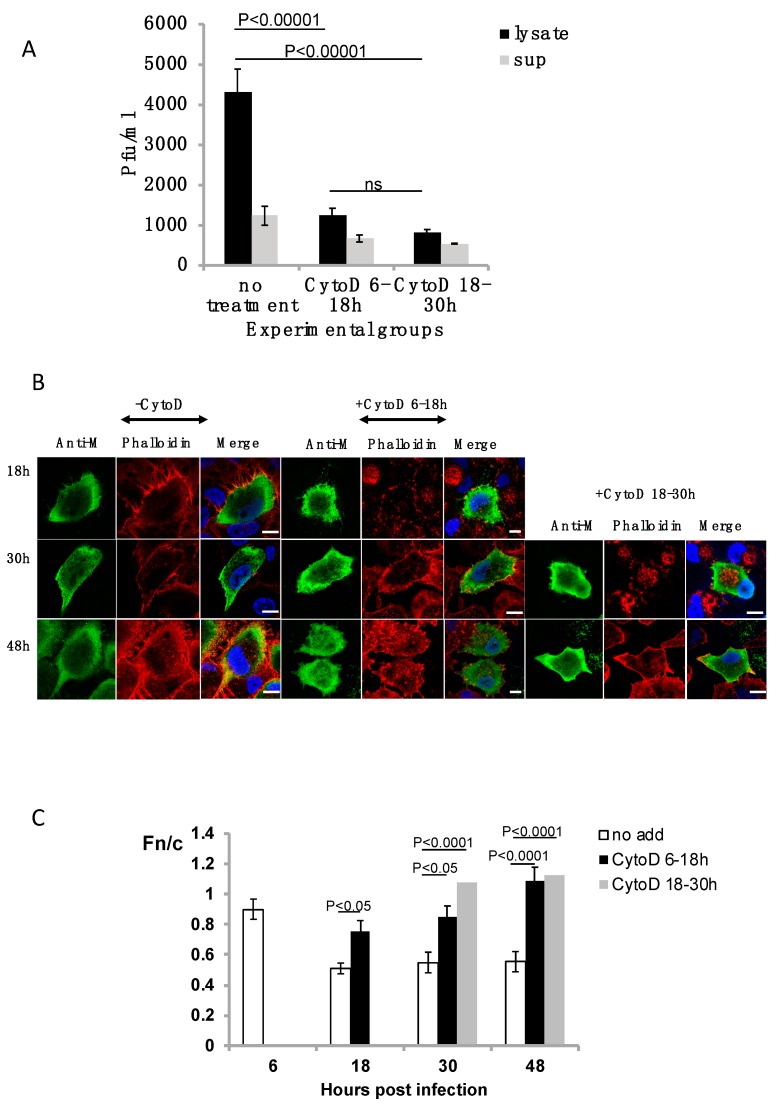
Treatment of respiratory syncytial virus (RSV)-infected A549 cells with cytochalasin D. Overnight cultures of A549 cells were infected with RSV A2 at MOI = 1. Cells were either left untreated (no treatment) or treated at early (6–18 h p.i.) or late (18–30 h p.i.) times in infection with cytochalasin D (CytoD). (A) A549 cells were infected with RSV (MOI = 1) and either left untreated or treated (experimental groups) with cytochalasin D early (6–18 h p.i.) or late (18–30 h p.i.) in infection. The cell lysates (lysate) and supernatants (sup) were collected at 48 h p.i., and infectious virus titer (pfu/mL) estimated by immunoplaque assay. (B) Infected cells were fixed at indicated times p.i. (numbers on the left) and probed for localization of M and microfilament network (phalloidin). Representative images are shown. Scale bars = 10 μm. (C) Images such as those shown in (B) were analyzed using ImageJ to determine the relative fluorescence of nucleus to cytoplasm (Fn/c) as shown. Data are mean ± SEM, n ≥ 15 from an experiment representative of three independent experiments. Statistically significant differences between groups are shown, ns = non-significant. p values were determined by 2-way ANOVA and significance accepted at p < 0.05.

