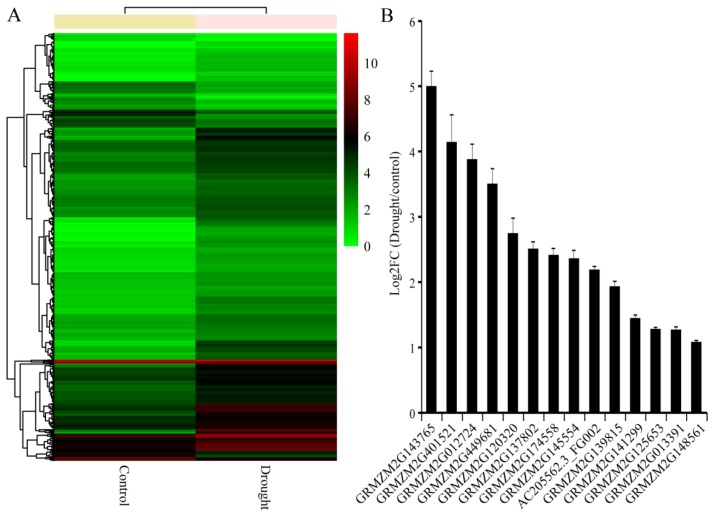
Figure 1.
De novo transcriptome sequencing analysis of maize under drought stress. (A) Cluster analysis of the differentially expressed genes (DEGs) under drought treatment. (B) Transcription levels of the 14 differentially expressed ZmWRKYs under drought treatment. Error bar represent standard deviations (SD). The data represent means ± SD of three biological replications.

