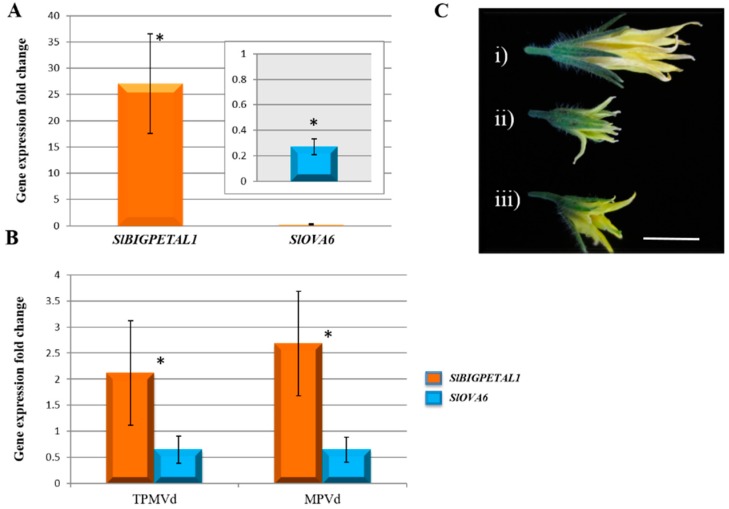
Figure 3.
SlBIGPETAL1 and SlOVA6 flowering-related genes. SlBIGPETAL1 and SlOVA6 gene expression in flowers (A) compared to leaves (B) in TPMVd and MPVd viroid-infected flower tissue. (C) Comparative size of flowers (i) mock-inoculated, (ii) TPMVd and (iii) MPVd-infected flowers. Bar = 1 cm. Gene expression values are relative to mock-inoculated controls to which a value of 1 was assigned. The EF-1α elongation factor gene was used as an internal reference. Error bars indicate two times the value of the standard deviation (SD) for the corresponding data set. Asterisks indicate statistical significance when analyzed using a paired t-test (p < 0.05). Where both treatments are statistically significant from mock-inoculated controls, one asterisk is placed above the bars.

